Most people pay their debts for years… without ever knowing the total amount they owe. In one study, simply writing down every balance sped up payoff by nearly a fifth. So here’s the twist: the fastest way to start getting out of debt isn’t paying—it’s counting.
Knowing what you owe isn’t the same as having it in front of you. Most people carry a “fog number” in their head—rough guesses, rounded balances, a card they’d rather not think about. That mental blur is expensive. When everything stays fuzzy, your brain treats debt like background noise instead of a target.
This episode is about turning that fog into a dashboard. We’re going past “I think it’s around…” to exact balances, interest rates, and minimums—on every card, loan, and lingering bill. Not to shame you, but to give your decisions a hard edge.
You’ll see how a written inventory quietly changes your behavior: which payments you prioritize, how you react to new purchases, even how you feel when a statement hits. We’ll also pull three critical numbers from your list—total load, average interest, and how much of your income debt is eating—so your next move isn’t a guess; it’s a calculation.
Now we’re going to zoom in a level. Think of your numbers less like a single big total and more like a row of very different ingredients on a counter. A 21% store card that tempts you with coupons belongs in a different mental bucket than a low-rate student loan quietly auto-drafting each month. One drains you fast, the other just sips. When you separate these pieces, patterns start to surface: which debts grow between statements, which barely move, which feel small but eat a shocking chunk of your paycheck. That clarity is what turns a vague “I should do better” into a specific “this is where I strike first.”
Start with the debts that hide best.
The ones on “set and forget” autopay. The buy-now-pay-later split into four “no big deal” chunks. The old medical bill you meant to call about but never did. These are the leaks that quietly reshape your month without ever demanding your full attention.
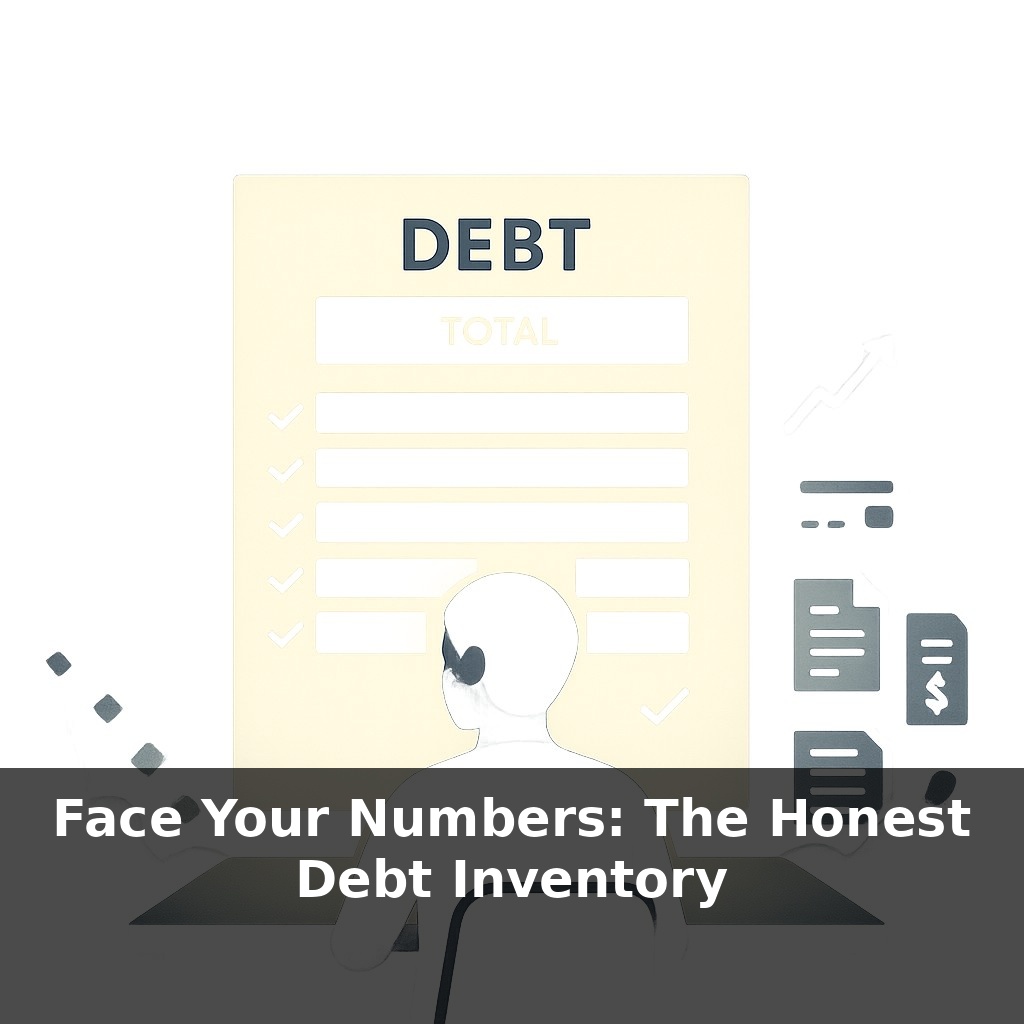
To drag everything into the open, you’re going to build a grid—not a journal, not a feelings page, just a hard-edged table. Across the top, list these columns:
1) Lender / account name 2) Type (credit card, BNPL, auto, student, personal, medical, family, etc.) 3) Current balance 4) Interest rate (APR) or fees 5) Minimum monthly payment 6) Due date 7) Whether it’s on autopay (yes/no) 8) Variable or fixed rate 9) Months remaining (if it has an end date)
Now go hunting, one source at a time:
- Credit report: Pull one free report and cross-check every open account. This catches the card you cut up but never closed, or the store financing you forgot was technically a loan. - Banking app: Scroll the last two to three months. Every repeating payment that isn’t a utility or subscription might be a debt. Note who it’s going to and how much. - Email + texts: Search “payment due,” “statement ready,” “BNPL,” “Afterpay,” “Klarna,” “affirm,” “financing,” and any lender names you remember. Those “just $37 today” purchases belong in the same grid as your big balances. - Paper: Shoeboxes, drawers, glove compartment. Anything with “amount due” and a date gets logged, even if you’re disputing it. You can adjust later—right now, it’s about full visibility.
As your grid fills, you’ll notice clumps: several small balances with brutal rates, or one giant loan that looks terrifying but barely moves each month. That contrast matters. A scattered mental list can’t show you that a handful of “tiny” debts might be costing more interest than your largest balance.
Here’s the key twist: don’t sort or judge yet. Keep the exploration mode on. You’re not choosing a strategy; you’re building the map that will make strategy obvious. The goal at this stage is completeness, not cleverness. One missed account can throw off every decision that comes next.
When the last line is filled, you’re ready to turn this static grid into a working tool: organizing by cost, risk, and emotional weight, so each future payment has a clear job instead of being “just what’s due this month.”
A useful way to read your grid is to scan it like a weather radar instead of a spreadsheet. Where are the red zones—accounts that “storm” your cash flow if you leave them alone for a month or two? Where are the calmer blue patches that barely shift? That contrast helps you see which balances are mostly noise and which are structural hazards.
Try looking at it three different ways. First, reorder by *payment size* and circle anything that would really hurt if your income dipped for a month—those are your pressure points. Second, order by *how annoying* each debt feels: the one from a job loss, a breakup, or a hospital visit might deserve faster resolution just to clear mental space. Third, sort by *flexibility*: which lenders allow hardship plans, refinancing, or 0% transfer offers?
You’re not acting on this yet, just noticing. Often, people discover a single line item that, if removed, would make the rest of the grid feel instantly manageable. That’s the kind of leverage point we’ll use in later steps.
A few years from now, your “once-a-year spreadsheet” could feel as outdated as mailing checks.
As banks, lenders, and apps start talking to each other in real time, your inventory may update itself: a new card opened, a promo rate ending, a BNPL plan halfway paid. Instead of you hunting for changes, they surface like notifications in a group chat. That same stream of data can flag when your stress indicators spike, prompting earlier course corrections before money problems start steering your choices.
Your challenge this week: treat that grid like a living document. Each time money moves—raise, side gig, surprise bill—add a brief note beside the most affected line. Over a month, you’ll see which entries keep “lighting up.” Those hotspots are your first candidates for aggressive payoff, negotiation, or restructuring in the next phase.