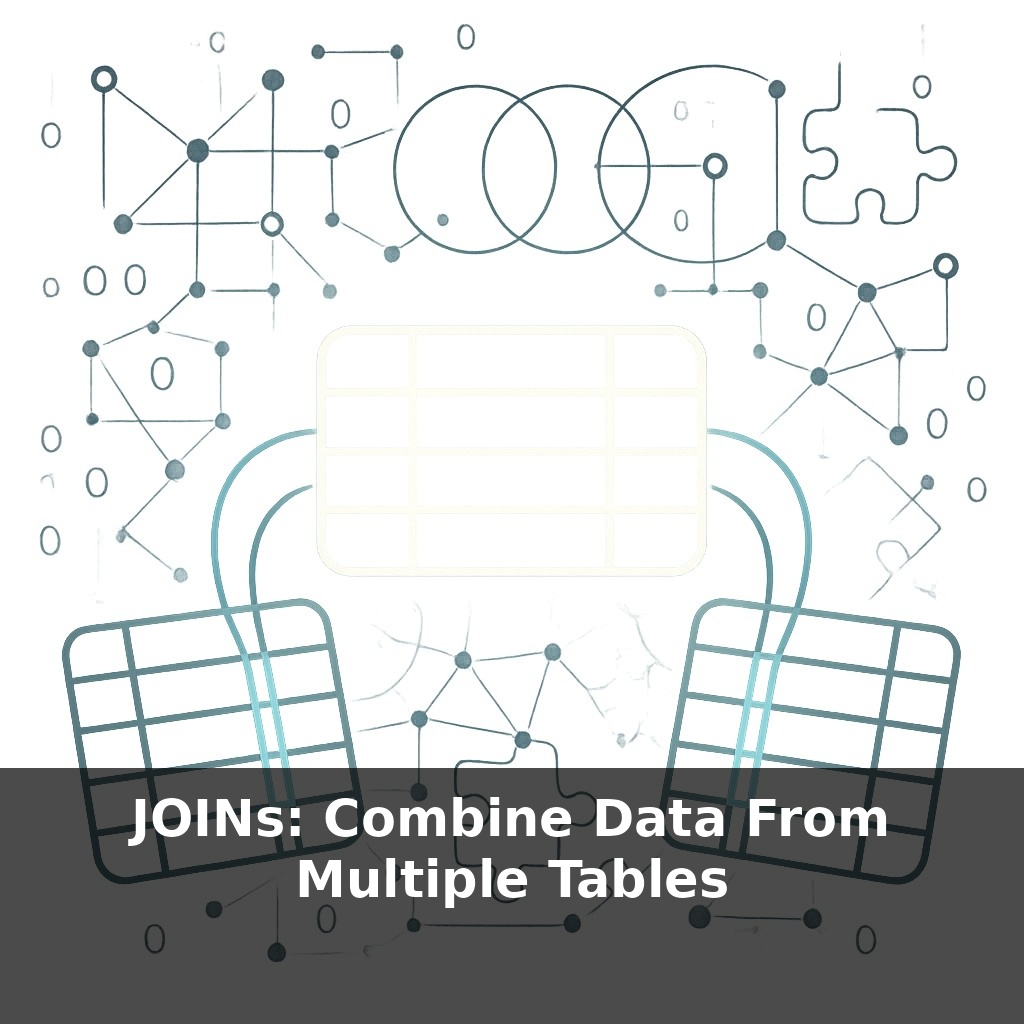
Most business dashboards become almost useless the moment data is split across tables. Yet a single well‑written query can reconnect customer clicks, orders, and refunds in one view. In this episode, we’ll walk through how analysts quietly pull off that “all at once” magic.
Forty years after SQL was invented, the most valuable queries many analysts run still revolve around one idea: combining tables. Not by copying and pasting spreadsheets, but by defining *relationships* the database can understand and reuse. When you JOIN, you’re telling the database which rows “belong together” across different worlds: behavior, transactions, inventory, support, and more.
In this episode, we’ll focus on two workhorse JOINs you’ll use constantly: INNER JOIN and LEFT JOIN. We’ll see how they can turn scattered facts into a clear story about each customer, product, or campaign. Instead of exporting three CSVs and wrestling with them in a BI tool, you’ll learn to ask the database for a single, coherent answer.
By the end, you’ll be able to read and write JOINs confidently—and spot when a missing JOIN is quietly breaking your analysis.
The real power of these JOINs shows up once you add realistic tables: users, sessions, payments, support tickets, product catalogs. Each table is tidy on its own, but most questions you care about live *between* them. Who signed up but never paid? Which products attract traffic but almost no purchases? How many support tickets come from your highest‑value customers? JOINs let you follow a single user or product as it “travels” through these tables, so instead of staring at isolated metrics, you trace complete journeys and spot where things actually break.
A surprising thing about JOINs: the database usually doesn’t run them in the order you write. You might carefully line up three tables in your query, but the optimizer quietly rearranges them, picks algorithms (hash join, nested loop, merge), and chooses indexes to hit the result with minimal work. This is why a multi‑million‑row INNER JOIN can still finish in milliseconds when your keys are indexed well.
To see JOINs in action, zoom in on a concrete question: “Which marketing campaigns brought in paying users who later contacted support?” That single sentence touches at least three ideas—acquisition, payments, and support—but you want one row per user summarizing their story. Instead of exporting separate reports, you push the complexity down into SQL:
- Start from the table that defines your grain (for example, one row per user). - JOIN outward to add only the context you need (their first payment, their latest ticket, their campaign). - Filter *after* the JOINs to avoid throwing away users prematurely.
INNER vs LEFT now becomes a design choice, not a syntax drill: do you want to *exclude* users without payments or tickets, or keep them with NULLs so you can ask “how many never converted?” LEFT JOINs shine for those “include even if missing later steps” questions.
Performance‑wise, notice two levers you fully control:
1. **Join keys.** Matching on an ID that’s indexed and unique (like `user_id`) is vastly cheaper and safer than joining on messy fields like names or emails. When both sides are large and unsorted, a hash join can beat nested loops by 2–10×, especially in warehouse engines.
2. **Data shape.** Pulling only the columns and rows you need keeps JOINs fast. A narrow, well‑filtered query encourages smarter plans than “SELECT * FROM everything.”
In practice, analysts at e‑commerce companies routinely combine order history with product metadata to power recommendations and merchandising. One often‑cited Amazon report claimed that weaving these tables together materially lifted recommendation‑driven sales—an early proof that better JOINs can literally change revenue, not just dashboards.
Your challenge this week: write one query that answers a real question across at least two tables you haven’t combined before. Use a LEFT JOIN first, inspect the NULLs to see where journeys “break,” then try switching to INNER JOIN and compare how your story about the data changes.
Think about a hospital trying to understand outcomes. One table lists patients, another lists treatments, a third logs follow‑up visits. A single question—“Which treatments lead to fewer emergency returns?”—forces these worlds to meet. You might start from patients, then pull in treatments and follow‑ups to see who slipped through without a check‑in. NULLs here are not just “missing data”; they hint at missed appointments, lost contact, or workflow gaps that clinicians can act on.
Now shift to weather data: forecasts, actual measurements, and damage reports. Combining these lets a city see which neighborhoods consistently suffer more than predicted and adjust warnings or infrastructure. JOIN choices change the story: include only locations with damage, or keep every forecasted area and reveal where nothing went wrong?
Your challenge this week: pick a question where the “bad” or missing outcomes matter, not just the successes. Use a JOIN to surface those blind spots, then decide what follow‑up analysis they deserve.
JOIN choices will matter even more as tools evolve. Auto-generated SQL from BI layers, AI copilots, or low-code apps will happily stitch tables together, but they can’t tell when the logic is subtly wrong. Knowing *why* you keep certain rows or accept NULLs lets you audit those tools instead of blindly trusting them. Think of it like tasting a simmering sauce: automation can chop and stir, yet you still decide whether the flavor balance makes sense for the question you’re serving.
As you keep experimenting, notice how each JOIN subtly rewrites the question you’re asking. It’s like adjusting lenses on a camera: one setting sharpens loyal buyers, another reveals silent churn, another exposes odd glitches in tracking. Over time, you’ll start designing schemas, not just queries, so future questions become simpler instead of messier.
Here's your challenge this week: Pick two tables you actually use (for example, `customers` and `orders`, or `users` and `logins`) and write four queries: one `INNER JOIN`, one `LEFT JOIN`, one `RIGHT JOIN` (or simulate it if your DB doesn’t support it), and one `FULL OUTER JOIN` (or a `UNION` of `LEFT` + `RIGHT`). For each query, count the rows returned and jot a one-line explanation of what *kind* of records are included or excluded (e.g., “LEFT JOIN shows all customers, even those with zero orders”). Then, change the join condition once (e.g., add a date filter or move a condition from `ON` to `WHERE`) and compare how the row count and result set change.