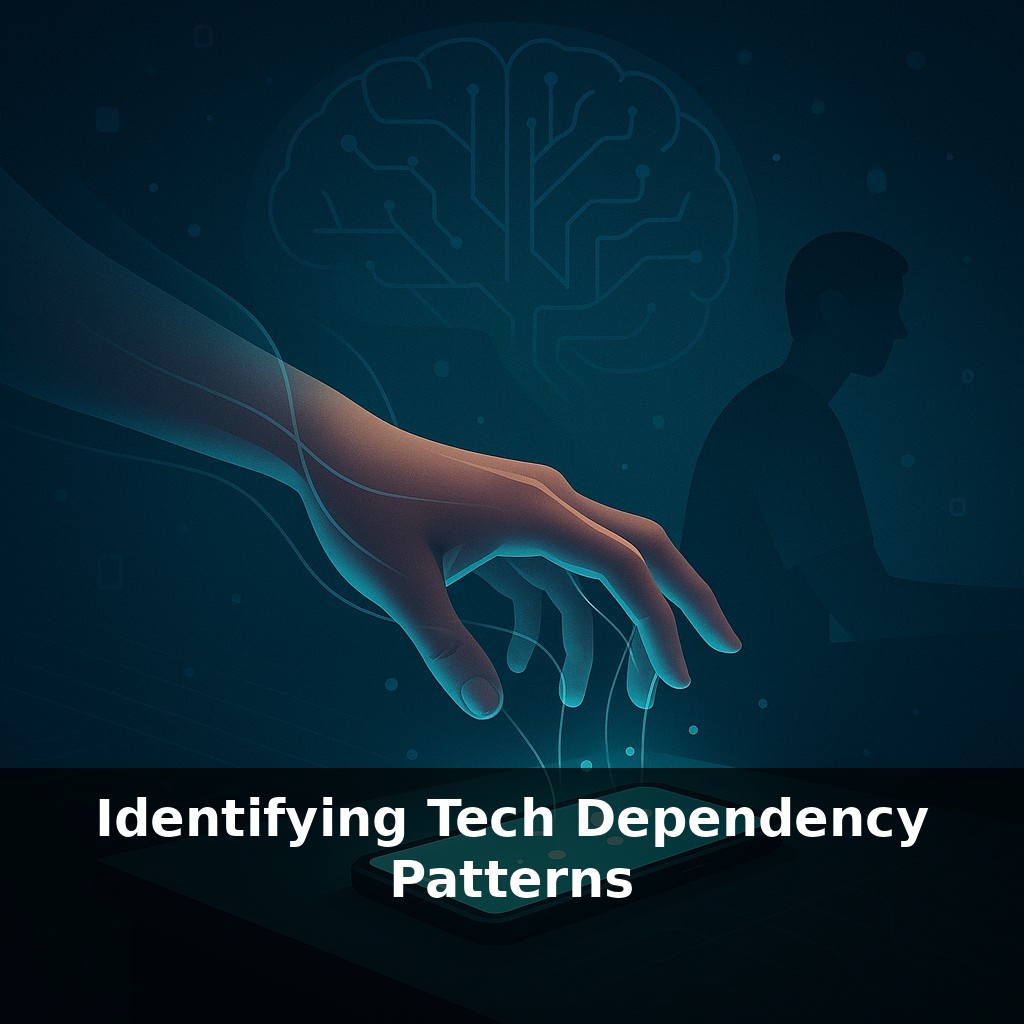
Identifying Tech Dependency Patterns
📝 Transcript
Right now, the average adult taps or checks their phone about a hundred times a day—most can’t name even ten of those moments. You're in a meeting, at dinner, in bed, and your hand moves on its own. So here’s the puzzle: if *you* didn’t decide to reach, what did?
That tiny, almost invisible moment—your hand moving before you’ve “decided”—is where tech dependency hides. Neurologically, your brain is running a well‑worn shortcut: dopamine anticipation spikes, prefrontal brakes loosen, and your body completes the loop before your conscious mind even checks in. Psychologically, these loops are reinforced by anxiety (“What am I missing?”), boredom, or stress, each turning the phone into a reflexive coping tool. Behaviorally, it shows up as micro-checks: in elevators, at red lights, between sentences in a document.
What’s shifting now is that these patterns are becoming *measurable*. Screen-time dashboards, app-open logs, even wearable stress markers can reveal the exact times of day, emotional states, and contexts where your technology begins to drive *you*, instead of the other way around.
Think of this episode as a kind of architectural survey of your digital life: we’re not knocking walls down yet—we’re just mapping the load‑bearing structures. The goal isn’t to shame your habits, but to surface patterns you can actually *see*: the apps that always seem to open when you’re tired, the late‑night sessions that quietly erode sleep, the “quick checks” that stretch into missed focus blocks. AI‑powered tools are already doing this at scale for companies and platforms; here, you’ll borrow the same mindset to study a single, very specific system: you, over the next few days.
Think of this section as switching from “noticing weird creaks in the house” to quietly walking around with a clipboard and a tape measure. Now that you’ve seen those tiny, automatic reach‑for‑phone moments, the next step is to figure out *what kind* of dependency pattern you’re running.
Researchers usually see three broad signatures:
1. **Reward‑Chasing Loops** These show up as rapid, frequent checks: unlock, glance, nothing much, repeat. The behavior clusters around anything that can deliver a small “win”—notifications, feeds, unread counts. Neuroimaging work on social media shows dopamine surges similar to small gambling payouts; behaviorally, that looks like you chasing “maybe this time” hits. When your usage graph is a jagged skyline of tiny peaks all day, you’re in reward‑chasing territory.
2. **Escape‑and‑Numb Patterns** Here, the phone isn’t about excitement; it’s about *relief*. You dive into games, long video sessions, or endless scrolling right after stress spikes: tough email, awkward conversation, late‑night worry. The WHO’s data on problematic gaming sits right inside this category—use moves from “fun” to “functional anesthesia.” It often costs you sleep, deep work, or real‑world recovery time.
3. **Obligation Spirals** This looks socially acceptable, even productive—constant messaging, email, work apps—until you notice there’s never an *off* switch. You respond instantly, keep every channel warm, and feel guilty stepping away. The behavior is driven less by pleasure and more by anxiety about others’ expectations, or missing opportunities. The outcome is similar: mental fragmentation and chronic stress.
AI‑driven analytics are very good at spotting these shapes in the data: dense clusters of late‑night usage, bursty micro‑sessions, or work apps bleeding into every hour of the day. But you don’t need enterprise‑grade tools to start. Most phones already log *when* and *how* you interact; wearables can hint at *what state* you were in—elevated heart rate, shallow sleep, constant “lightly active” fidgeting.
Your job this week isn’t to cut usage; it’s to tag it with *meaning*: - “Was I chasing a tiny reward?” - “Was I escaping something?” - “Was I answering a perceived obligation?”
Once those tags become visible, “too much screen time” stops being a vague guilt and starts to look like a few specific, repeatable loops you can actually redesign.
Think of three friends, each with a different “digital signature.” Sam’s graph is a spiky seismograph: dozens of 20‑second bursts in messaging and social apps between tasks. If you watched a replay of his day, you’d see him orbiting tiny red dots—badges, alerts, pings—never staying in deep focus for long.
Maya’s pattern is smooth but heavy: long, contiguous blocks at night in video and games. Her usage looks calm on a chart, but if you overlaid sleep data, you’d see bedtimes quietly drifting later, and recovery scores sliding down through the week.
Luis looks “on call” around the clock: productivity, chat, and email show up in thin streaks from breakfast to midnight. No single session is huge, yet there are almost no tech‑free gaps longer than 30 minutes. His stress metrics plateau instead of spiking; he never fully powers down.
AI tools are starting to classify patterns like these automatically, but you can learn a lot by just noticing which of these three you resemble at different times of day.
As pattern‑tracking matures, your phone could feel less like a slot machine and more like a coach. Multimodal AI may quietly notice: “Three late‑night scroll marathons in a row; sleep debt rising,” then offer tiny course‑corrections—a darker UI, slower notifications, or a suggested wind‑down playlist. Cities might join in: Wi‑Fi‑free paths through parks, focus booths in libraries, commute zones where signals fade like a dimmer switch instead of cutting out abruptly.
Your challenge this week: treat your data like a feedback studio. Once a day, glance at your usage and jot the *moment* that surprised you most—like finding a light left on in an empty room. Over a few days, those surprises start tracing a blueprint, hinting where tiny structural tweaks could make the whole system feel calmer.

Unlock all episodes
Full access to 5 episodes and everything on OwlUp.
Subscribe — $1.99/monthLess than a coffee ☕ · Cancel anytime