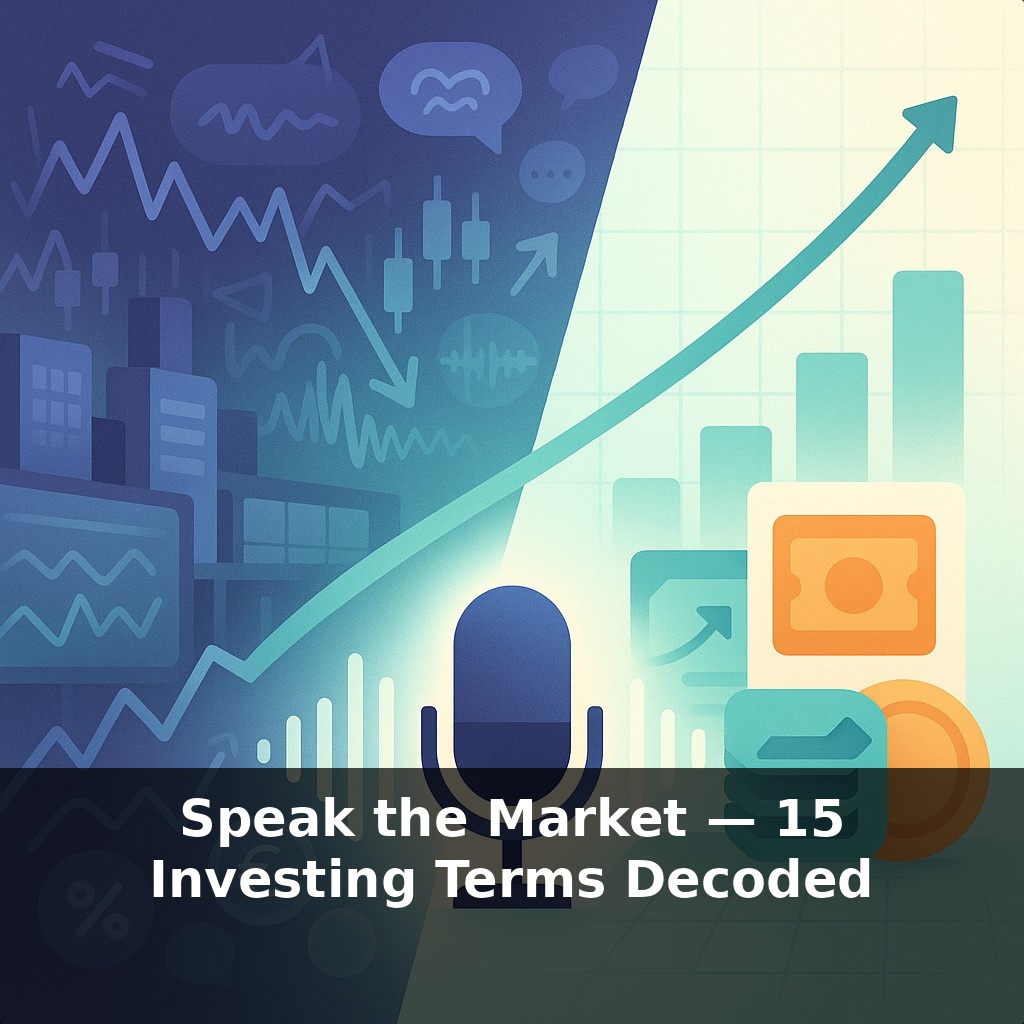
A single page of investing jargon can sound like another language—yet about four out of five conversations boil down to just a handful of core terms. In this episode, we’ll walk into that noisy “Wall Street” room and quietly translate the words that actually matter.
A headline says “stocks plunge as volatility spikes; investors flee to bonds,” your app shows an ETF you’ve never heard of, and your friend brags about “dollar-cost averaging into index funds.” All of that can feel like noisy chaos—but it’s mostly the same 15 ideas wearing different outfits.
In this episode, we’ll decode those 15 terms so you can finally follow the plot. You’ll see how “market cap” explains why Amazon became a trillion‑dollar giant, why diversification matters more than a hot stock tip, and how bull and bear markets fit into the long‑term story of growth.
We’ll connect the dots between concepts your broker, favorite podcast, and news alerts keep throwing at you, so each notification starts to feel less like an alarm, and more like a line in a language you’re actually starting to read.
Think of this episode as getting a backstage pass to the “language” behind every investing screen you see. When your app flashes red or green, it’s really just updating a few basic ideas: how much things cost, how fast they’re changing, and how they fit together in your overall plan. We’ve already peeked at the big picture with market cap and diversification; now we’ll zoom in on the moving parts—things like interest quietly compounding, prices swinging around, and cash flowing in and out—so the next time markets surge or slump, you’re reading signals, not reacting to noise.
Let’s start on the ground floor: **what you actually buy** when you invest.
A **stock** is a slice of ownership in a company. Own one share of Amazon, and you’re literally a tiny co‑owner. If the business grows and profits rise, investors are usually willing to pay more for each slice, so the share price tends to climb. If the company stumbles, that price can drop—sometimes sharply. Growth potential is high, but so is the risk.
A **bond** is different: it’s an IOU. You’re lending money to a government or company, and they promise to pay you interest and return your principal at a set date. Stocks are about owning; bonds are about lending. Stocks usually offer more growth over decades; bonds usually offer more stability and income, though they can still lose value.
Instead of picking individual names, many beginners use **index funds** and **ETFs** as “containers.” An index fund is a basket designed to track a specific list of investments—like the 500 largest U.S. companies. An **ETF** (exchange‑traded fund) is a similar basket, but it trades on the stock market all day, like a single stock. Both give you instant spread‑out exposure; ETFs just add the flexibility of intraday trading.
That flexibility interacts with **liquidity**—how quickly and easily you can turn an investment into cash without moving the price much. Big ETFs on major indexes and large, frequently traded stocks are highly liquid: lots of buyers and sellers at almost every moment. A thinly traded small‑company stock or obscure bond can be harder to exit at a fair price.
The price you see is constantly shaped by **supply and demand**, but also by how investors feel about a company’s profits. One quick snapshot of those expectations is the **P/E ratio**—price divided by earnings per share. If a stock trades at 30 times its earnings while a peer trades at 10, the market is either expecting faster growth, assigning a quality premium, or getting overly optimistic. A low P/E, meanwhile, could signal a bargain…or a business in trouble. The number doesn’t give you the answer; it gives you a question to investigate: “Why this price for these earnings?”
Zooming out, all of these tools feed into **asset allocation**—how much of your total portfolio sits in stocks, bonds, and cash‑like holdings. For a 25‑year‑old saving for retirement, the mix might lean heavily toward stocks; for someone five years from retirement, it might tilt more toward bonds and cash to steady the ride. The mix, not the individual ticker symbols, usually does most of the work in shaping your long‑term outcome.
Think of your brokerage app as a set of “dials” you can actually learn to read. **Volatility** is the dial that shows how wildly prices have been moving—like checking the day’s weather report. A calm market is a clear sky; sudden storms mean wider swings. High volatility doesn’t automatically mean “bad,” but it does mean your account balance may look very different from one day to the next.
Now connect that to **dollar‑cost averaging (DCA)**. When you invest the same dollar amount on a schedule—say $200 every payday—you automatically buy more shares when prices are temporarily knocked down by a stormy week, and fewer when optimism pushes them higher. You don’t have to guess the “perfect” day.
Add in **dividends**—cash many companies and funds pay out from their profits—and you get another quiet helper. Reinvest those into more shares, and they become fuel for **compound interest**, steadily increasing how much of the market you own, even when headlines feel noisy or confusing.
Knowing the language is step one; step two is noticing how it quietly shapes your choices. The same “stormy” week that scares headlines higher can be a gift to a DCA plan, like a seasonal sale most people walk past. As robo‑advisors spread and tokenized assets trade around the clock, those price flickers may feel even louder. Your edge won’t be reacting faster, but recognizing which moves are true signals—and which are just background noise in a very talkative market.
As these terms click, you’ll start noticing patterns: a headline becomes a roadmap, an advisor’s comment turns into a clue, an account statement reads like a story in progress. Your challenge this week: when you see any term from this list, pause and ask, “What decision is this hinting at—risk, time, or goals?” Capture the answer in one short sentence.