A company can look wildly successful and be one bad week away from running out of money. An online retailer doubles its sales, stock price climbs, everyone’s celebrating—until the bank calls. On paper, it’s winning. On the balance sheet, it’s quietly running out of runway.
Investors, lenders, and acquirers don’t fall in love with your product first—they fall in love with your balance sheet. It’s the one document that quietly answers three brutal questions: “If things go wrong, how long can you survive? Who gets paid first? And what’s really left for you?”
That’s where assets, liabilities, and equity stop being textbook words and start becoming strategy. Is your “cash cushion” actually a thin blanket? Are your suppliers secretly financing you? Is your growth built on retained profits or stacked debt?
In this episode, we’ll pull apart real-world patterns: why Apple can sit on tens of billions in cash while other firms borrow just to make payroll, why a 2:1 debt-to-equity ratio can be either a red flag or a power move, and how current vs non-current items quietly shape your next big decision.
On the surface, two founders can run the same-size business and take home wildly different amounts of stress. The difference usually lives in line items most people skim past: how much is tied up in inventory, whether customers pay in 15 days or 75, if that “great loan deal” quietly triples risk when revenue dips. Regulators even let some industries reorder their balance sheet to highlight what matters most—banks, for instance, lead with liquidity. The trick isn’t memorizing line names; it’s learning to spot which ones control your freedom to move next quarter.
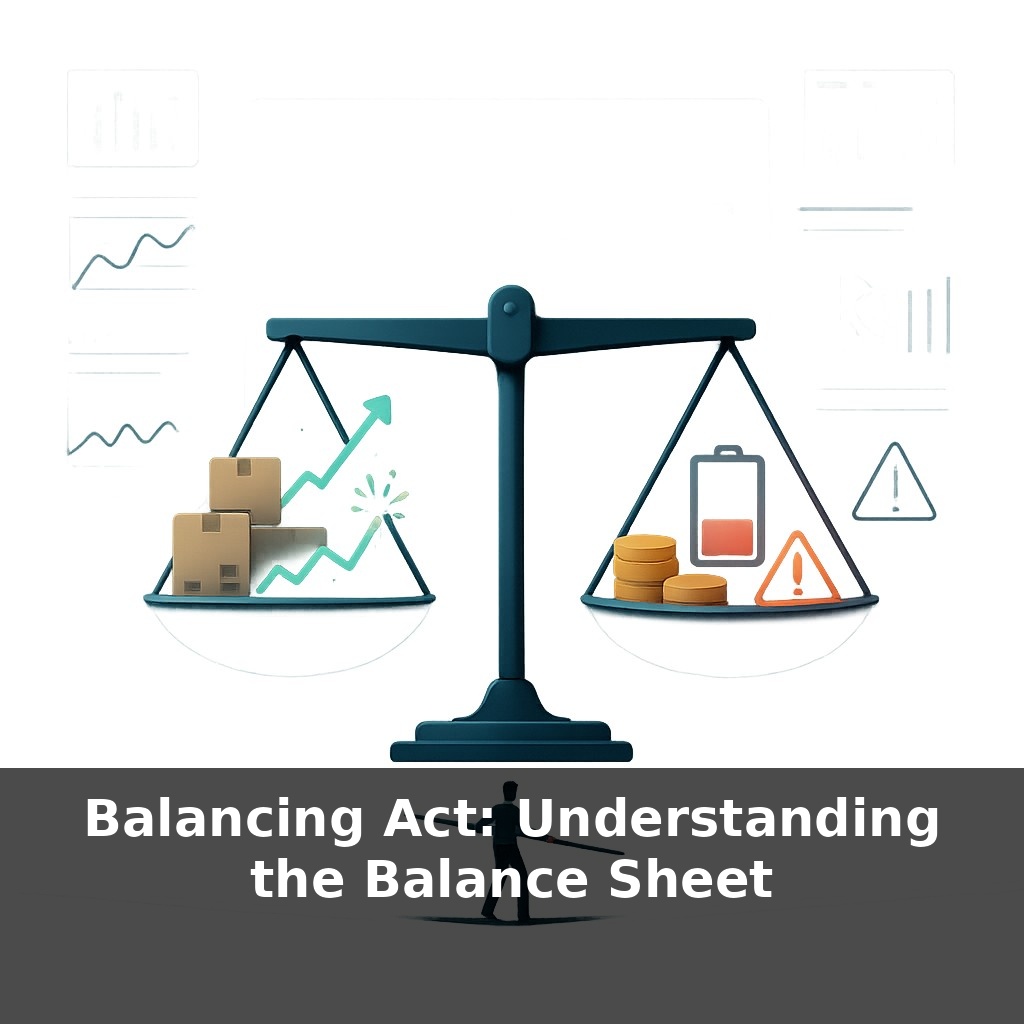
Open almost any set of financials and the balance sheet looks deceptively calm—three tidy columns of numbers, no drama. The drama lives in the relationships between those numbers.
Start with a simple split: what’s tied up vs what’s flexible. Two businesses can each show $1M in “stuff,” but one has most of it sitting in slow-moving equipment while the other holds a large, liquid position—say, Apple-style cash and equivalents. Same total, radically different freedom. That freedom shows up in ratios people quietly obsess over: how much you could turn into cash in the next year, and how much of that is already spoken for.
Now move to obligations. It’s not just “how much do we owe,” but “when” and “to whom.” A bank loan due over five years, supplier credit due in 30 days, and taxes payable next quarter don’t carry the same pressure. Stack too many short-term promises against limited near-term resources and you’ve engineered your own stress test. That’s why sophisticated readers don’t just glance at total debt; they trace the staircase of due dates.
Then there’s the owner’s slice. Equity isn’t just “what’s left”; its composition tells a story. Has the business been funding itself mostly through retained results, or repeated capital injections? A company that has grown equity steadily without constant rescue capital usually has more negotiating power—with banks, investors, even acquirers—than one propped up by fresh money every year.
Standard-setters quietly reinforce these priorities. Under IFRS, splitting items by timing isn’t optional; the current vs non-current discipline forces management to confront how near-term reality lines up with long-term bets. In some U.S. industries, regulators flip the layout entirely, listing the most liquid items first so readers can judge resilience at a glance.
If the income statement is about “how exciting was this year,” this statement is closer to clinical medicine: vital signs, organ function, underlying conditions. One tells you how hard the business has been working; the other tells you how strong it actually is.
A few concrete patterns make this less abstract. Take two startups, each showing $500k owed to others. One owes most of it to a founder loan due “whenever things stabilize.” The other owes it to a bank with strict covenants and a fixed repayment schedule. Same total, wildly different leverage in a tough quarter.
Or compare a profitable consulting firm and a profitable manufacturer. The consultant might show fewer tangible line items but a thick buffer in retained results and low obligations. The manufacturer could show a bigger total size but be tightly bound by equipment leases and bank lines. If both hit a sudden revenue dip, the consultant can often scale down faster; the manufacturer must still feed the fixed structure.
In practice, readers zoom in on how flexible you are under stress: how many obligations accelerate if results slip, how dependent you are on one lender, how much “owner’s stake” can absorb surprises before outsiders take control. Those quiet details often matter more than headline profit.
Future balance sheets may feel less like static tables and more like living dashboards. As intangibles and environmental exposures move on-screen, you’ll see value and risk shift almost like weather maps—patents fading, brands strengthening, carbon costs swelling. With AI auto-closing the books and blockchain hardening the trail, small businesses could watch their position update in near real time, turning “month-end” from an event into just another timestamp.
Your challenge this week: pull your latest balance snapshot and circle three lines that would hurt most if they vanished tomorrow. Cash, a credit line, a key supplier—whatever they are. Then, for each, jot one move to strengthen or replace it. Like tuning an instrument, tiny adjustments here can change how boldly you can play your next move.