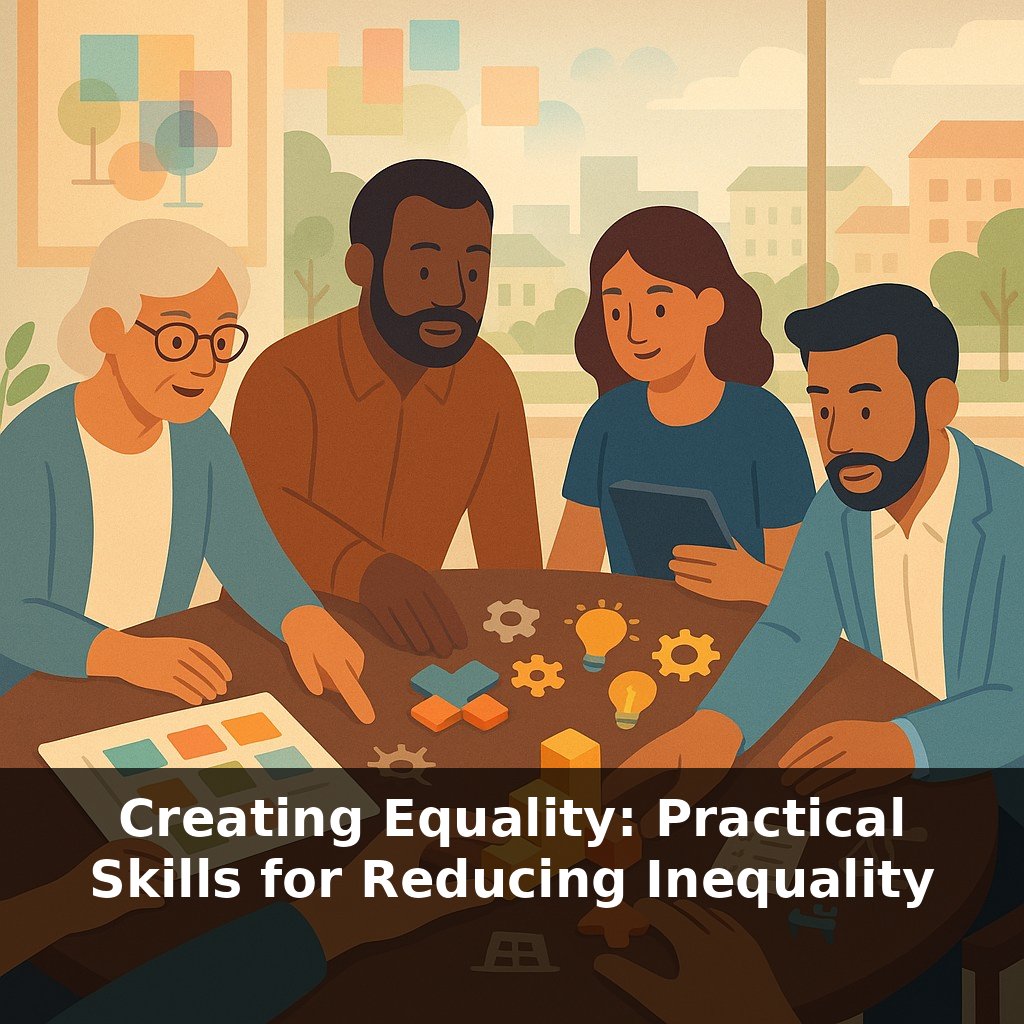
The richest one percent grabbed well over a third of all new wealth in recent decades—yet many of our “inequality” policies were drafted on hunches and headlines. In this episode, we drop into the real room where policies are written—and quietly rewritten—before anyone votes.
“Countries that spend more than a quarter of their economy on social transfers end up with significantly lower inequality than those that don’t.” That OECD finding isn’t a moral slogan; it’s a measurable pattern. And it forces an uncomfortable question: if we already know some tools work, why do so many governments still choose weaker ones?
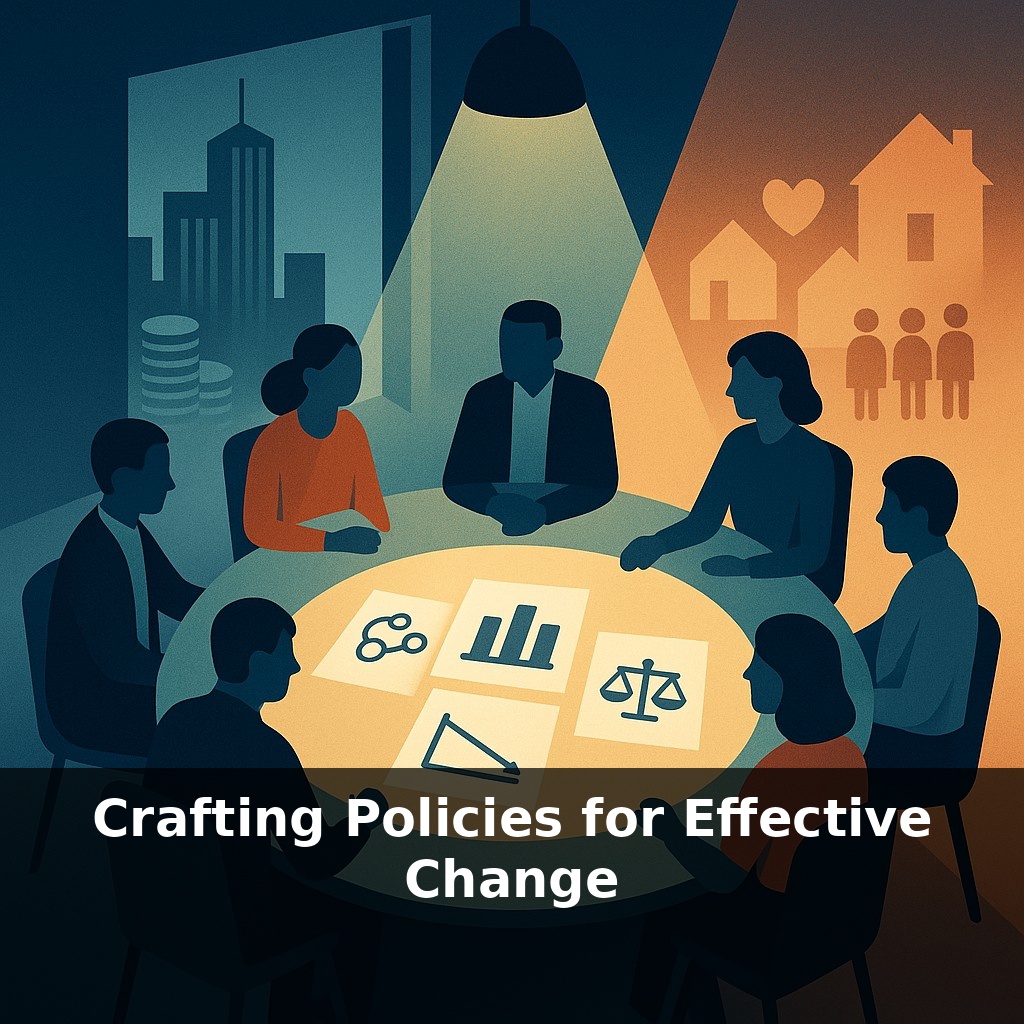
In this episode, we move from abstract debates about “fairness” to the nuts and bolts of crafting policies that actually shift the numbers on the ground. We’ll look at how programs like Bolsa Família and the Earned Income Tax Credit got from early proposals to large-scale impact, and what went wrong—or right—along the way. Think of this as opening the hood on real-world change: who gets into the room, which data survive political pressure, and how feedback from affected communities can reroute a policy before it hardens into law.
In this part of the journey, we zoom in on how different tools actually lock together: tax rules, labor standards, competition policy, and investments in schools, clinics, and transit. Think of them less as isolated levers and more as instruments in a band: a brilliant solo tax reform can be drowned out if wage rules or capital markets keep playing off‑key. We’ll also see why good intentions stall without solid data, why stakeholder “consultations” often miss the people most affected, and how feedback loops can quietly re‑tune a policy before it hits the main stage.
When countries have actually bent the inequality curve, they didn’t stumble into it. They followed a rough sequence—messy, political, but surprisingly repeatable.
It usually starts with a sharp, narrow objective: not “reduce inequality,” but “cut child poverty in half in ten years,” or “raise the share of wages in national income by five points.” That level of precision decides everything that follows: which ministries matter, which data you collect, and which trade‑offs you’re willing to accept.
Then comes the hard, unglamorous part: building a shared map of the problem. That means integrating tax records, labor-market surveys, price data, even local clinic and school information into one picture. In practice, it’s often scattered across incompatible systems and guarded by agencies that don’t like to share. Countries that move faster on reform often invest early in statistical capacity and legal rules for safe data-sharing, so the “map” can actually be drawn.
Only after this do the main tools get lined up: how much to raise and spend, what to regulate in labor and capital markets, where to direct public investment. The key is alignment. A new minimum wage without wage-theft enforcement, or a progressive tax change without closing loopholes, creates paper victories and real disappointment.
Politics enters not just in final votes, but in who helps draft the rules. Unions, business associations, mayors, civil-society groups, and frontline workers all see different failure modes. When they’re brought in early—with actual drafts on the table rather than finished products—the final package tends to be simpler to implement and harder to quietly dismantle.
Think of it like designing a bridge: engineers model stress points, local residents flag how people really move, budget officers set cost limits, and inspectors build in monitoring. No single group can see every risk; it’s the interaction that keeps the structure standing over decades.
Finally, the countries that avoid backsliding treat new policies as provisional. They pre-commit to review dates, build in automatic data collection, and publish indicators that are simple enough for journalists and citizens to track. That turns course correction from an admission of failure into part of the plan.
Consider two neighboring cities that both want to “level the playing field.” One launches a flashy new benefit but leaves application forms only in the capital’s language, open 9–11 a.m. on weekdays. The other pilots the same benefit in three districts, co-designs forms with street vendors and nurses, and runs sign‑ups at markets and bus stops. A year later, both can claim the same law on paper, but only one has meaningfully shifted who shows up in the data.
Or take labor rules: a country might pass strong protections, then allocate almost no inspectors, so violations stay invisible. Another pairs new rules with a public dashboard that shows which regions investigate complaints, which industries comply, and how long cases take to resolve. Suddenly, local officials compete not just on growth, but on fairness metrics their voters can see.
These differences look small in drafting meetings—an extra pilot here, a data field there—but they compound. Over a decade, they can mean the gap between symbolic reform and a measurable drop in hardship.
Digital tools are about to change how we argue over fairness. With real‑time data, a wage rule could be updated like a software patch instead of waiting for a full election cycle. But faster adjustment also risks “policy whiplash” for families and firms. As AI filters who gets training offers, loans, or audits, the real fight will move into the code itself—who writes it, whose outcomes are tested, and who can see when the algorithm quietly drifts away from the goals we agreed on.
We’re still early in learning how to “debug” social rules the way we debug code—pushing small updates, checking for crashes in people’s lives, rolling back when damage appears. Your challenge this week: pick one local rule you live under, trace who wrote it, and ask what evidence would convince them to rewrite line one.