One in five Americans spends more than they earn—yet most people can’t say, out loud, what “more” actually means in their life. You’re at the checkout, card in hand, trusting a guess. Is money flowing in or quietly leaking out? This episode pulls that guesswork into the light.
Most people can quote their salary but go blank when asked, “So where does it all go every month?” The gap between what hits your bank account and what’s left on the 30th often feels mysterious—until you realise it isn’t a mystery, it’s just unmeasured. Research is blunt about this: the people who actually write down their income and expenses tend to carry less debt and hit goals like building an emergency fund or investing years earlier than those who don’t.
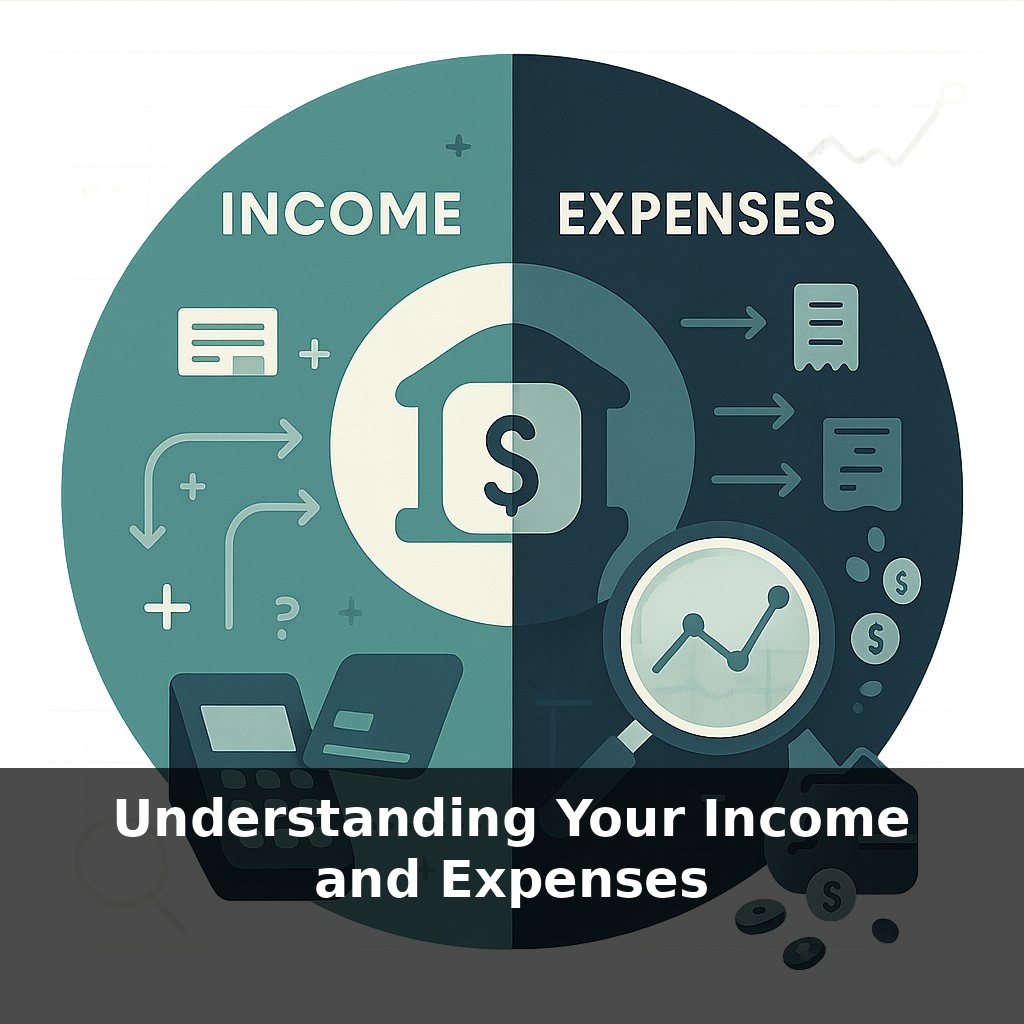
In this episode, we’ll turn your monthly money flow into something you can see and work with. We’ll map every inflow—paycheck, side hustle, benefits, interest—and every outflow, from rent and groceries to subscriptions you forgot you had. Instead of reacting to bank alerts, you’ll build a simple personal cash‑flow snapshot that shows, in black and white, whether your month ends with a cushion or a cliff—and what to change next.
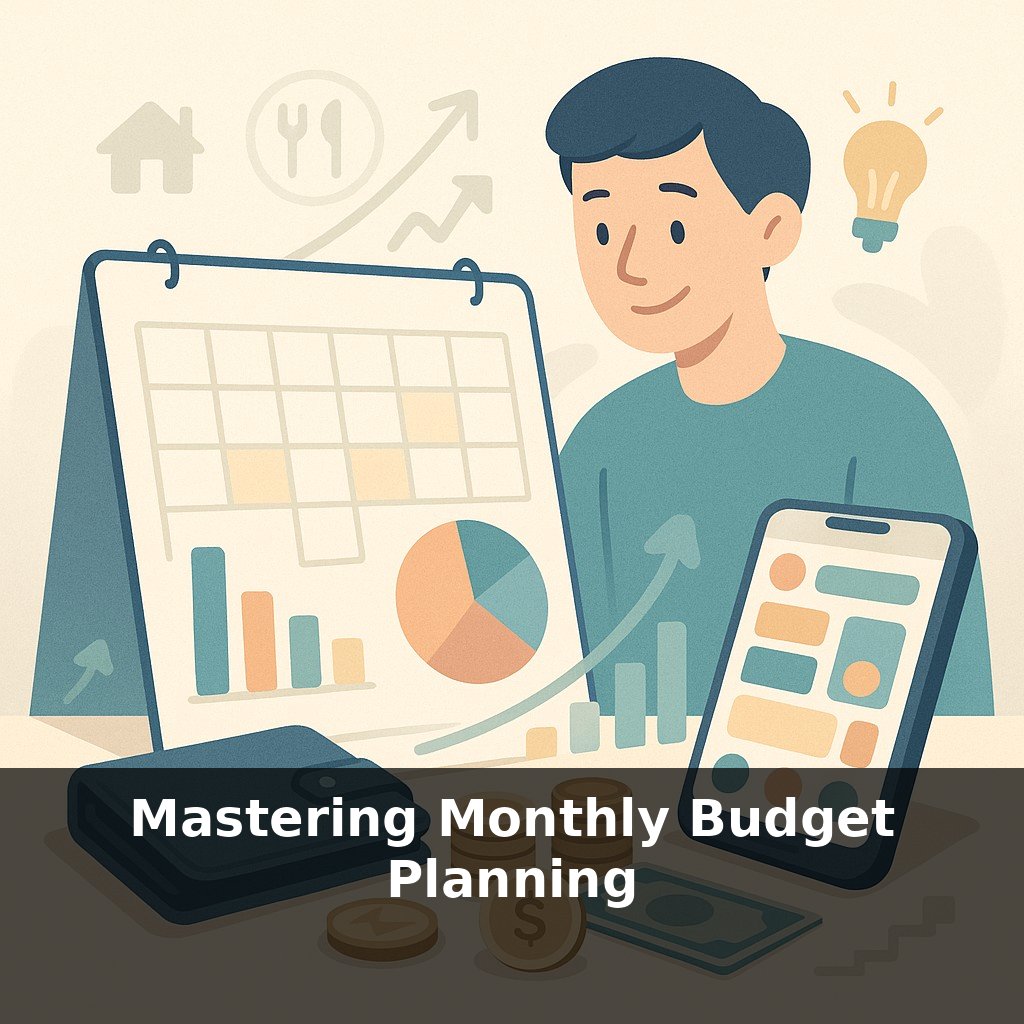
Think of this step less like “budgeting” and more like running a simple experiment on your life. For one month, you’re going to collect evidence: every source of cash in, every dollar out, sorted into clear buckets. Not to judge yourself, but to see what’s actually happening. We’ll separate fixed commitments (rent, minimum debt payments, insurance) from flexible choices (dining out, streaming, impulse buys) and notice how much room you really have. As you do this, patterns emerge—peaks on payday, dips before rent, quiet drips from small charges—that turn vague stress into concrete data you can act on.
Think of this stage as zooming in. You’re not just noting that “money comes in, money goes out”—you’re about to find out *what kind*, *how often*, and *how controllable* each stream really is.
Start on the income side. Most people stop at “my salary is X,” but your real number often looks different. Check the last two or three months of bank statements or pay stubs and list every recurring inflow: paycheck after tax, side gigs, child benefits, tax credits, rental income, interest or dividends actually hitting your account, even regular cash from family. Next, flag what’s predictable versus occasional. A quarterly bonus or once‑a‑year tax refund is helpful, but it shouldn’t be propping up your month‑to‑month life. You’re trying to answer: “What can I reasonably count on every month without crossing my fingers?”
Now turn to expenses with more precision. Instead of one long list, split them by how much control you have *this* month. Housing, basic utilities, minimum loan payments, essential transport, and groceries form your “can’t skip without consequences” list. Everything else—takeout, upgrades, nicer brands, extra data plans—belongs with “choices I *am* making, even when they feel automatic.”
Here’s where the categories from research help. Housing and utilities around a third of income is “average,” not “required.” If you’re at 45 %, that imbalance explains pressure elsewhere. Transportation near 16 % and food near 12 % are similar guideposts, not commandments. Comparing your percentages to those benchmarks shows which parts of your lifestyle are quietly outsized.
When you subtract expenses from income, don’t just stop at the leftover number. Ask three questions: Is this surplus/deficit consistent each month? Which categories would change fastest if my income dropped by 10 %? And which one or two lines, if reduced, would move the needle the most?
One helpful metaphor: treat your categories like apps on your phone’s home screen. The ones you tap constantly should be front and center; the ones you barely use don’t deserve prime space—or full‑price subscriptions. Your cash‑flow statement works the same way: essentials up front, rarely‑used expenses questioned, and anything you can’t name or justify gets dragged to the trash.
Open your banking app and scroll through the last 30 days like you’re reviewing someone else’s life. See three different coffee shops? That’s a “micro‑treats” category. A rideshare, a parking ticket, and a bus pass? That’s a “mixed transport” category. You’re not judging; you’re pattern‑spotting.
Next, group by *role* in your month: “keeps me functioning” (meds, basic phone plan), “keeps me connected” (internet, one or two key subscriptions), “keeps life fun” (restaurants, hobbies, upgrades). When a line item feels hard to place, highlight it—those fuzzy edges often hide the biggest leaks or the best opportunities.
Use concrete tags instead of vague labels: - “Work lunch” vs “social dinner” - “Need‑to‑own” (commuter shoes) vs “nice‑to‑own” (third pair of sneakers)
One helpful cooking analogy: treat each category like an ingredient in a recipe. Salt, oil, and staples deserve space in the pantry; that exotic sauce you used once doesn’t need a permanent place—or a monthly reorder.
Banks and apps are quietly racing to become your financial “home screen.” As open‑banking rules spread, you’ll be able to plug all your accounts into a single dashboard in minutes, then let algorithms flag odd spikes, forecast crunch points, and suggest tiny tweaks before they hurt. Your detailed cash‑flow picture won’t just guide your choices; lenders and employers may use it too—potentially rewarding stability, but also raising tough questions about who sees your financial “movie” and why.
As you refine this snapshot, start testing small “what‑ifs”: a rent increase, a new job, a car repair. Treat them like weather forecasts for your bank balance, not doom scenarios. Over time, you’ll see which tweaks—canceling one subscription, negotiating a bill, shifting a due date—change the story fastest, and where your next raise should really go.
Here’s your challenge this week: Log every dollar you spend for the next 7 days into a simple “Needs vs. Wants” chart with three columns: Date, Category (housing, food, transportation, debt, fun, etc.), and Need/Want. At the end of the week, total how much went to fixed expenses (like rent, utilities, minimum debt payments) versus variable expenses (like eating out, subscriptions, impulse buys). Then choose ONE “want” category where you’ll cut a specific dollar amount next week (for example, “$25 less on takeout”) and decide exactly where that money will go instead (emergency fund, debt payment, or savings).