An oil shock in the seventies cut supply by only about a tenth—yet prices almost quadrupled. In this episode, we drop you into that moment. Why did a “small” change unleash such chaos, and why does the same hidden force shape your rent, your groceries, even your used car?
Step away from oil for a second and look at something closer to your daily routine: that streaming subscription you almost canceled last month, the rent that jumped just as your lease renewed, or the used car that somehow costs more than a new one. None of these prices are random, and they aren’t set by “greedy companies” alone. They emerge from millions of decisions—who’s willing to pay what, and who’s willing to sell or produce at what cost.
Now layer in shocks: a new city regulation on short‑term rentals, a sudden boom in remote work, or a missing chip in a global supply chain. Each one nudges people to change their plans—move, delay a purchase, switch products—and those tiny adjustments ripple through markets.
In this episode, we zoom in on that ripple process: how shifting demand and supply lines quietly redraw the price tags in your life.
Think about how quickly things now update around you: your rideshare fare jumps between two taps, plane tickets change mid‑search, and that limited‑edition sneaker sells out before you finish entering your size. Behind those flickers of change is something surprisingly structured: a constant tug‑of‑war between how badly people want something and how costly it is to keep offering it. The outcome isn’t just “the price today.” It’s who gets access, who gets pushed out, and which businesses quietly disappear—or suddenly boom—when conditions shift. In other words, these curves help decide economic winners and losers.
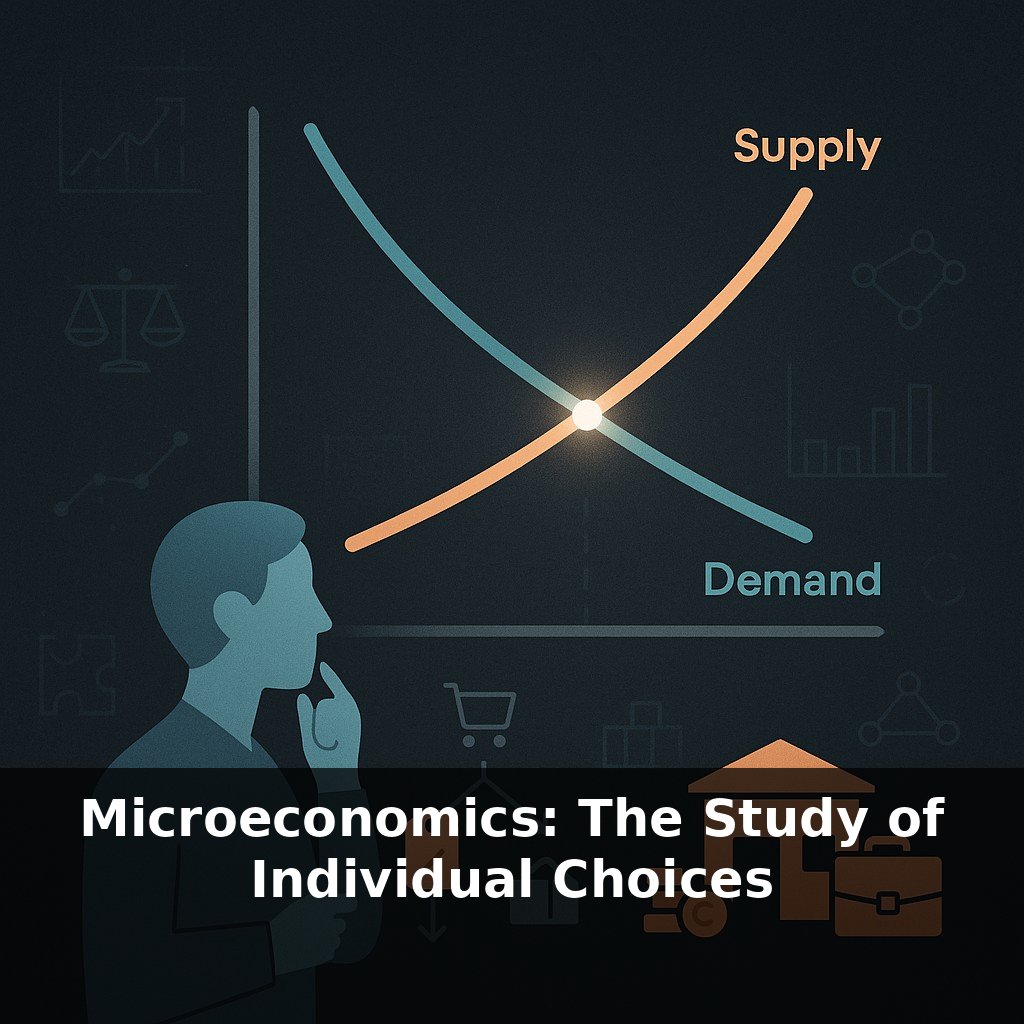
Zoom in on a simple graph: one downward line, one upward line, crossing once. That crossing point might look like a classroom sketch, but it encodes something powerful: at that combination of price and quantity, nobody has a reason to change their plan. Buyers who value the good at least that much are in; sellers who can cover their costs at that price are in; everyone else steps aside.
Economists care about this point not just because the market “clears,” but because of what sits around it: surplus. Consumer surplus is the gap between what buyers were willing to pay and what they actually pay. Producer surplus is the gap between the lowest price firms would have accepted and what they actually receive. At the crossing point, the sum of those gaps is as large as it can be—allocative efficiency. Move away from it, and someone who values the good more than it costs to produce gets blocked, or someone who doesn’t value it enough ends up with it.
Now add rules. When governments cap rents below that crossing, more people want apartments than landlords are willing to provide: excess demand. Some get cheaper housing; others just get longer waiting lists, key‑money, or crumbling buildings as maintenance becomes less attractive. Flip it: set a minimum wage above the crossing. More hours are offered than firms want to hire: excess supply of labor. Some workers earn more; others don’t get hired at all, or get fewer hours, or move into informal work.
Real‑world markets layer on frictions, uncertainty, and bargaining power, but the basic geometry still helps decode news stories. The OPEC shock? A leftward shift of one curve, magnified by how steep the other was. The used‑car spike? A production bottleneck plus a sudden revaluation of mobility when public transit felt risky. Even Amazon’s rapid‑fire price changes are just an automated attempt to keep jumping back toward that wandering crossing as new data arrive.
The twist is that the “right” crossing isn’t about fairness; it’s about maximizing the size of the total surplus pie. Who gets which slice—that’s a different, and often more political, question.
Open the resale section of a concert app on the day tickets drop. At 10:01, seats are gone at face value. By noon, you see wildly different offers: a few desperate sellers undercutting, fans listing at 5x hoping for a whale, most hovering in a tight band. Nobody coordinated this. Each person just tests: “At this price, do I still get a buyer?” or “At this price, do I still get in the door?” Those scattered guesses slowly cluster.
Now shift to a local coffee shop that adds mobile orders. Suddenly, the line *looks* shorter, but the espresso machine is slammed. Without changing its posted prices, the shop quietly “rations” with time: regulars accept a longer wait; some marginal customers drift to the café next door. Same dance, different currency.
Think of a basketball team running set plays. The coach calls one scheme, but players constantly read the defense, cutting and passing into open space. No single move determines the score; it’s the ongoing adjustment that matters. Markets, too, are less about a frozen “right” number and more about a live system that keeps re‑routing who gets what when conditions shift.
Surge pricing on ride‑share apps, “lightning deals” online, even dynamic electricity tariffs all hint at where we’re headed: markets that constantly re‑tune themselves in response to your habits, the time of day, and even the weather. As climate rules tighten and AI gets better at forecasting, the crossing point you saw on a static graph becomes a moving target. The opportunity is sharper signals about scarcity; the risk is that those signals become too fragmented to feel fair.
Markets won’t hand you a verdict; they hand you clues. Each “sold out,” each empty restaurant, each oddly cheap flight is a data point about what others chose. Your challenge this week: treat every out‑of‑stock label and sudden discount like a plot twist, and ask, “Who just changed their mind—and what might they know that I don’t?”