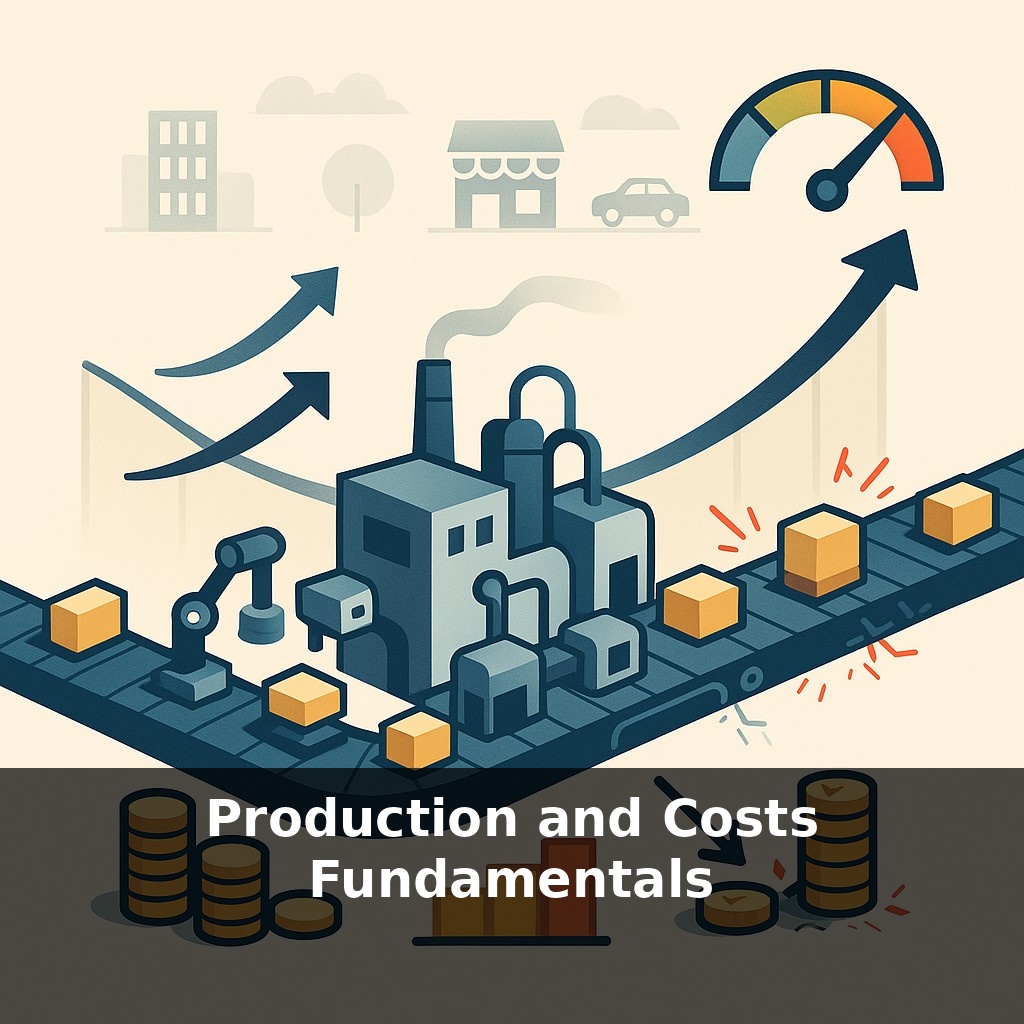
Factories can grow, cut costs, and still lose money on every extra unit they produce. A fast‑growing startup, a neighborhood bakery, and a global car maker can all make the same quiet mistake: confusing “making more” with “making profit” when their costs start to bend.
An assembly line that runs faster isn’t always a win; sometimes every extra turn of the belt quietly erodes your gains. This is where production decisions get serious: not “Can we produce?” but “Exactly how much should we produce before the next unit stops pulling its weight?” That pivot point lives in the relationship between how your costs change and how your revenue changes at the margin. In the short run, you’re trapped with some commitments—plants, leases, salaried teams—that won’t budge no matter what you do this week. In the long run, almost everything can be redesigned: capacity, technology, even where you operate. A tech manufacturer choosing between one mega‑factory and three smaller regional plants isn’t just thinking about output; it’s mapping how each extra unit will behave on the cost curve as the company grows—or overstretches.
Think of a firm’s cost structure as its playbook for growth: it dictates when to sprint, when to coast, and when to stop. Two questions secretly govern every scale‑up move: “Which bills follow us no matter what?” and “Which bills wake up only when we produce more?” As output rises, the second group—the ones tied to each extra unit—starts to write the story. Their behavior over different ranges of output shapes average cost, and that shape isn’t smooth. There are sweet spots, plateaus, and cliffs, and smart strategy is about steering operations to sit on the most forgiving parts of that curve.
A firm’s first constraint isn’t imagination; it’s the shape of its production function—how extra inputs translate into extra output. Early on, giving workers better tools or clearer processes tends to boost output more than one‑for‑one: marginal product rises. Later, crowd a few more bodies or machines into the same space and each adds less than the last. That slide—from increasing to diminishing marginal product—is the quiet engine behind the bend in cost curves.
To see why, track just one variable input—say, hours of skilled labor—while everything else is held in place. At low output, each extra hour unlocks underused capacity. Output jumps faster than costs, so the cost of each additional unit falls. Past a certain point, coordination frictions show up: people wait on each other, bottlenecks form, mistakes need rework. Now each extra hour adds less output than before, so the cost of each additional unit climbs. That turning point in productivity is the same place your marginal cost switches from drifting down to pushing up.
Average variable cost (AVC) and average total cost (ATC) are passengers in this story. As long as marginal cost lies below an average, it drags that average down; when it rises above, it pulls the average up. The minimum of AVC and ATC, then, isn’t arbitrary—it’s exactly where marginal cost slices through each curve. This matters operationally: if market price can’t at least cover AVC in the short run, each unit deepens your operating loss, and shutdown becomes the rational choice, even if some overhead is still being paid.
Shift to the long run and the playbook widens. Now the firm can choose plant size, technology, even location. The long‑run average cost (LRAC) curve traces the lowest feasible ATC at every scale by stitching together the best “plant options.” Over certain ranges, doubling scale might cut unit cost significantly through specialization, bulk purchasing, or better technology—mirroring the learning‑curve findings where costs fall with cumulative experience. But that process is not infinite. Stretch the organization far enough—thousands of employees, multiple layers of management—and the same forces that once gave scale its power begin to reverse it: slower decisions, misaligned incentives, and sprawling coordination needs thicken the cost per unit again.
In practice, strategic production planning means asking three linked questions: Where are we on the productivity path of our key inputs? Which short‑run plant configuration currently minimizes average cost at our target output? And looking ahead, what scale and structure shift will keep us on, or move us to, the lowest reachable segment of the long‑run cost landscape?
A useful way to see these ideas in action is to zoom into specific industries. Streaming platforms like Netflix face high upfront spending on a series, but once it’s produced, adding another viewer barely changes their outlay. They lean on this by chasing huge audiences: the more subscribers watch, the smaller the content bill per viewer feels, and the more sense it makes to outbid rivals for premium shows. Contrast that with a craft brewery deciding whether to buy a larger brewing system. The new kit might slash the labor and time per liter, but only if demand is strong enough to keep it running near capacity; otherwise, the “bigger” choice just locks them into higher overhead with idle tanks. A cloud‑services startup, meanwhile, can ramp server usage by the minute. Its key question isn’t just “grow or not,” but which mix of regions, data centers, and contracts keeps it on a flatter part of its long‑run cost curve as customer traffic swells and becomes more volatile.
Choosing a cost path is also a bet on uncertainty. A factory locked into one configuration is like a freight ship: efficient in calm seas, slow to turn in a storm. Flexible setups—modular lines, contract manufacturing, cloud‑based tools—are more like a fleet of smaller boats: pricier per unit in perfect conditions, but better at dodging shocks. As demand, regulation, and input prices swing, resilience can matter as much as today’s cheapest option on the spreadsheet.
In the end, production choices are less about a single “right” output and more about learning how your system bends as you grow. Treat each change in volume like a new data set: watch how delays, scrap, and overtime shift. Over time, those observations become a map, helping you redesign workflows the way a city upgrades its roads as traffic patterns evolve.
To go deeper, here are 3 next steps: (1) Open the free “Costs of Production” problem sets on Khan Academy (Microeconomics → Firm behavior and the competitive market → Cost of production) and work through at least one full set on marginal cost (MC) and average total cost (ATC) so you’re actually calculating the curves you heard about. (2) Pull up a real company’s 10-K (e.g., Tesla or Coca-Cola on sec.gov) and scan the “Cost of Goods Sold” and “Operating Expenses” sections, labeling each line in a simple note as “fixed” or “variable” based on the podcast definitions, then notice how that mix would affect their short-run vs. long-run costs. (3) Grab a blank Excel or Google Sheet and build a tiny “factory” model: assume a production function like Q = 10√L, plug in different labor levels (L) to compute output (Q), then let the sheet calculate total cost, MC, AVC, and ATC so you can see how diminishing marginal returns actually shape the cost curves discussed in the episode.