What Is a System? Seeing Interconnections
📝 Transcript
Right now, somewhere in the world, a single shipping delay is quietly reshaping store shelves, stock prices, and even your weekend plans. In this episode, we’ll trace how one tiny change can ripple through an entire system—often in ways no one intended.
Most people are trained to stare at the “pieces”: the underperforming team, the busted machine, the missed deadline. But in complex work and social life, the real story hides in the *connections* between those pieces. That’s why 95% of product delays in complex projects trace back not to a single broken part, but to systemic issues—hand‑offs, incentives, information gaps, and conflicting goals that quietly shape behavior over months or years.
Think of an urban commute at rush hour: each driver makes reasonable choices, yet together they create gridlock. No one intends the traffic jam, but the pattern emerges from thousands of small interactions. Systems behave this way too. And at larger scales—climate policy, healthcare, global supply networks—those interactions can amplify into billion‑dollar swings or life‑and‑death outcomes.
In this episode, we’ll start training your eyes to see those hidden interconnections—so you can work *with* systems instead of being blindsided by them.
A useful starting move is to zoom out from crises and look for patterns that repeat. Why do certain tensions—like burnout cycles at work, boom‑bust hiring, or recurring “urgent” policy debates—seem to resurface even after big fixes? That repetition is a clue you’re dealing with a system, not a one‑off event. Systems show up wherever flows accumulate: patients in hospitals, tasks in project tools, even rumors in group chats. Instead of asking, “Who slipped up here?” systems thinkers ask, “What ongoing structure makes this outcome likely, again and again, even with reasonable people trying their best?”
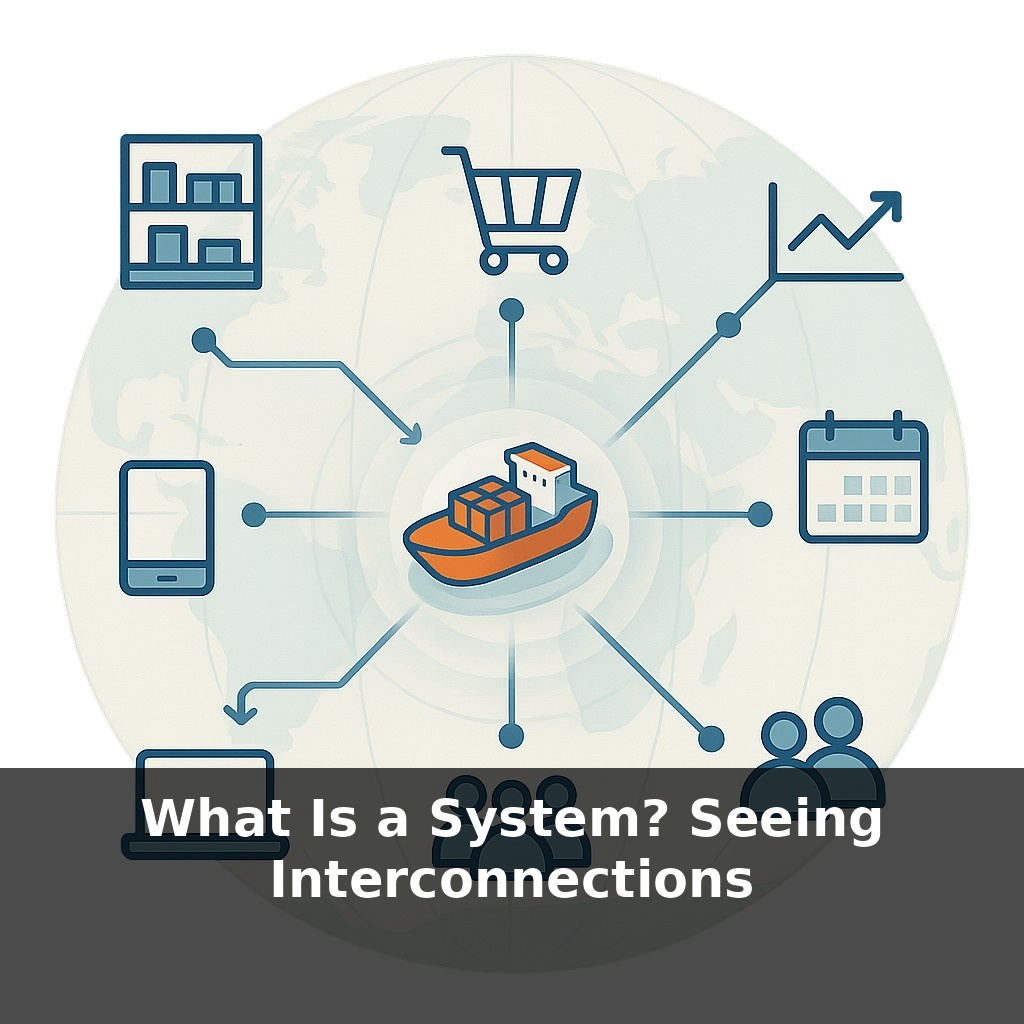
The quickest way to start seeing systems is to look for three things: **elements, flows, and feedback.**
Elements are the “things” you can point to: teams, tools, policies, customers, servers, classrooms, neighborhoods. On their own, they tell you *who* is involved but not *why* outcomes keep recurring.
Flows are what move *through* those elements: tasks through a Kanban board, patients through a clinic, money through a budget, messages through social media, carbon through the atmosphere. Wherever something is flowing and sometimes piling up, a structure is shaping behavior.
Feedback is the crucial twist: today’s outcome changes tomorrow’s conditions. A delayed feature release leads to more status meetings, which eat into focus time, which creates further delays. A hospital’s crowded ER scares patients, so they wait longer before seeking care, which makes their eventual cases more severe, which crowds the ER even more. The loop quietly reinforces itself.
Some loops **amplify** change (more leads → more sales reps → more outreach → even more leads). Others **stabilize** things (as service quality drops, complaints spike, triggering fixes that improve quality again). Real situations usually contain several loops tugging in different directions; what you observe is the net result.
Notice how often metrics and incentives tilt these loops. A company that rewards rapid ticket closure may “solve” issues superficially, pushing deeper problems into the future. A city that times traffic lights only for car throughput may discourage walking and transit, increasing car dependence and congestion over years.
One way to think about it: software code is less important than how modules call each other; similarly, organizations are less about org charts than about who must talk to whom, when, and with what information. Small changes to those relationships—who can say “no,” who sees which data, where delays occur—can transform outcomes far more than swapping out individual people or tools.
Consider a social media platform during a breaking news event. The *elements* are users, creators, moderators, algorithms. The *flows* are posts, likes, shares, flags. Now watch the *feedback*: a controversial clip gets rapid engagement; the ranking algorithm boosts it; more people react; creators notice and produce similar content; advertisers either flock to or flee the topic. Hours later, the trending page, ad prices, and even newsroom decisions have shifted. No single post “caused” the outcome; it emerged from their interactions.
A well‑known 2021 case: when a major chip manufacturer faced disruptions, it didn’t just slow one gadget. Game consoles, cars, medical devices, and even home appliances launched late or in limited runs. Firms that had mapped these interdependencies cushioned the blow by redesigning products and contracts, while others simply waited and hoped.
Like adjusting seasoning and heat while cooking a stew, those small, timely tweaks to interactions matter more than swapping one ingredient.
The next decade will reward people who can *sketch* how things interact before rushing to fix them. Urban planners are already using digital twins of cities to test housing or transit decisions like game developers tuning levels. Climate teams combine satellite data with local sensor networks to see emerging stress points early, much like spotting hairline cracks before a bridge fails. As tools improve, “show me the loop” may become as basic a skill as “show me the data.”
Once you start spotting loops, normal days feel different: a rushed email thread looks like a tiny traffic jam; a budget cut feels like pulling a brick from a Jenga tower. Your challenge this week: pause once a day and ask, “What would this look like as a diagram?” Over time, you won’t just react to outcomes—you’ll redesign the game.
From this course
Systems Thinking: See the Big Picture
7 episodesUnlock all episodes
Full access to 7 episodes and everything on OwlUp.
Subscribe — $1.99/monthLess than a coffee ☕ · Cancel anytime