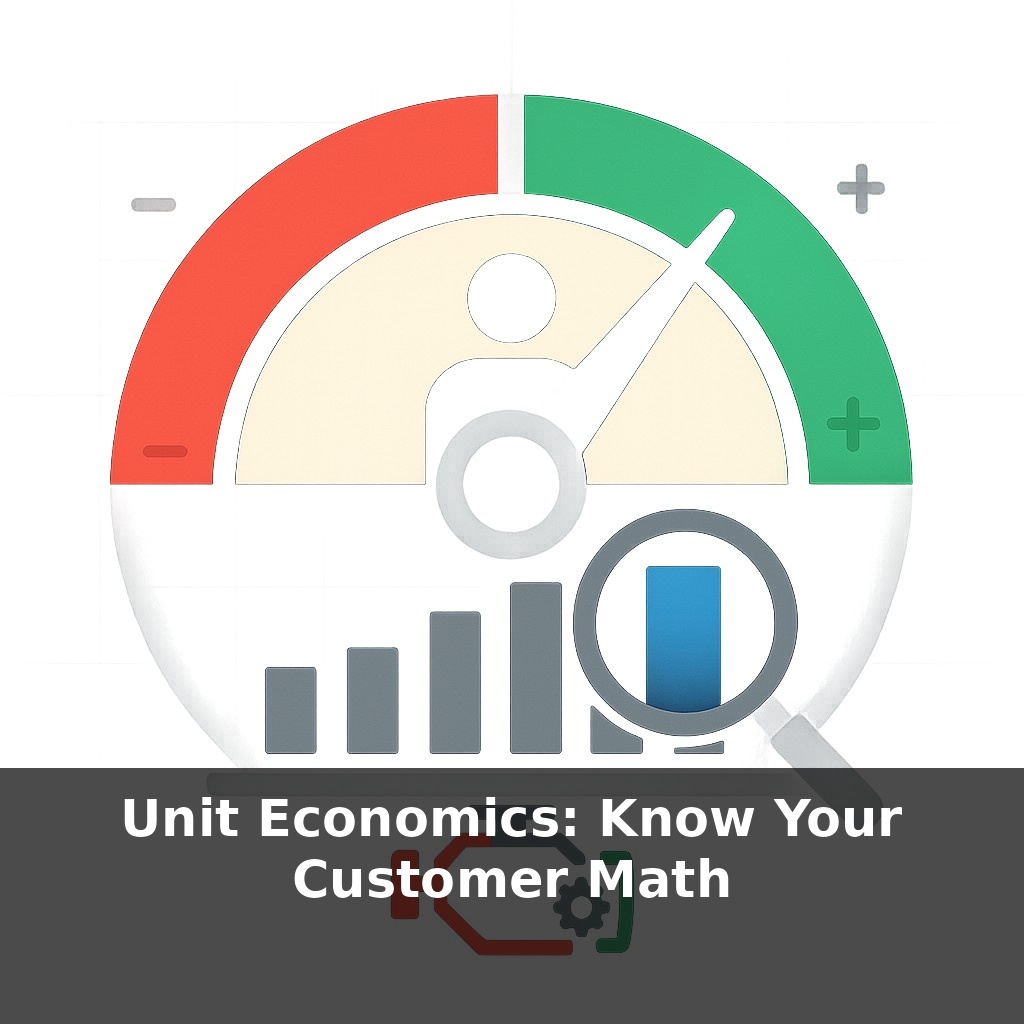
About half of the startups investors see look exciting on the surface—and are quietly losing money on every “great” new customer. A glowing dashboard, a growing user base, and still: each sale quietly burns cash. How do you tell the difference before the money runs out?
Investors won’t ask how “big” your market is first. Increasingly, they ask a quieter, sharper question: “What are your unit economics?” They’re not being pedantic—they’re checking if the engine under your growth story actually works. Unit economics zooms in from the blurry company-wide P&L to a single relationship: one customer, one order, one subscription. At that tiny scale, the story gets brutally honest. How much do you really earn after covering the direct cost to serve? How much did it cost to win that customer in the first place? And, crucially, do they stick around long enough to pay you back—with interest? When you know those answers, “growth” stops being a vanity metric and becomes a measured bet: you’re no longer just adding users; you’re deliberately buying streams of future cash flow.
Zoom in even further and you’ll find that “one customer” isn’t a fuzzy average—it’s real math with real consequences. Investors quietly run it in their heads: revenue per unit, variable cost per unit, CAC, LTV. They don’t just ask, “Are you profitable?” They ask, “Does each additional customer make the story better or worse?” That’s why an LTV:CAC below 1.5 makes them nervous, and above 3 turns heads. Think of it like a doctor reading vital signs: growth is the pulse, but contribution margin and payback period are the blood pressure and oxygen levels that tell you if the organism can survive scaling.
“Is this customer worth it?” sounds like a cold question—but that’s exactly what your numbers are answering, whether you look at them or not.
Start with the most brutal one: contribution margin per unit. Strip away everything that doesn’t scale with volume—no HQ rent, no founder salary, no brand campaign. What’s left, per order or per subscriber, is the real muscle of your business. If that number is negative, growing faster just means bleeding faster. If it’s thin, you’re one discount war or cost spike away from trouble.
Now link that margin to time. How many orders, months, or renewals does it take before the cash you earn from a customer has paid back what you spent to acquire them? That’s your payback period. A 2‑month payback with modest margins can be safer than a 24‑month payback with dreamy LTV on a slide, because reality is full of surprises: churn jumps, ad prices rise, behavior shifts.
This is where the LTV:CAC ratio stops being a vanity number and becomes a design target. Above ~3, investors lean in because it suggests two powerful things: you’re either retaining people well, monetizing them smartly, or both. Below ~1.5, they assume something fundamental is off—pricing, positioning, channel choice, or who you’re targeting in the first place.
Real companies treat these as levers, not fate. Amazon didn’t just “have” high LTV; it engineered it. Personalization nudges people to add one more item, come back one more time. That lifts revenue per active user without touching acquisition spend. Subscription apps that survive rising CAC do similar things: nudge annual plans, bundle features, remove friction at cancellation so fewer people leave emotionally charged.
Here’s the mindset shift: unit economics is less about today’s snapshot and more about how every experiment alters the curve. A retention tweak that cuts churn by a sliver can be worth more than a heroic new ad campaign. A pricing change that raises ARPU slightly may justify a higher CAC ceiling, unlocking channels that previously “didn’t work.”
The misconception is thinking of these numbers as static grades on a report card. Treat them instead like dials on a mixing board. Your job isn’t just to read them—it’s to keep tuning until each new customer clearly makes the whole system healthier.
A quick way to feel this in practice is to compare two very different businesses. Take a fitness app that charges $10/month and keeps users, on average, for 18 months. If their typical user also buys a $60 annual upgrade once, that’s $240 in total revenue from a single relationship. Now contrast that with a meal delivery service making $8 of contribution per order, but seeing many “tourist” customers who try it twice and vanish. Both can show impressive topline growth, yet the economics of one relationship are far more durable than the other.
You can also slice within one company. A B2B SaaS tool might discover that small teams on monthly plans churn quickly, while mid‑market customers on annual contracts stay for years and adopt add‑ons over time. Same product, radically different economics. That often leads to focused positioning: marketing, onboarding, and product all re‑oriented around the segment where each additional account compounds value, instead of just inflating logos on a pitch deck.
An investor once said, “Growth is vanity, margin is sanity, cash is reality.” Unit math is where margin and reality finally meet.
Your challenge this week: run a “worth it or not” experiment on one segment of customers. For every new subscriber or client in that segment, log three things: the channel that brought them in, their first purchase size, and whether they come back within 30 days. At week’s end, compare channels. Where are you getting people who return quickly and spend more, not just click more?
Implications As AI, privacy, and climate costs reshape the game, this math stretches beyond ad dashboards. Personalized pricing, smarter cross‑sell, and even “green premiums” shift who is profitable and why. Treat each segment like a portfolio of tiny projects: some deserve more capital, some need redesign, some should be quietly closed. The risk isn’t having “bad” customers—it’s not knowing which are secretly subsidizing the rest.
Treat this math like a map, not a verdict. As you test pricing, features, and channels, watch how the contours shift: some segments become fertile ground, others turn into deserts. The goal isn’t perfect precision; it’s to steer with clearer odds. Over time, those small, data‑backed bets stack like brushstrokes, revealing a business model that actually compounds.
Before next week, ask yourself: 1) “If I had to bet on one customer segment today, which specific group (by channel, behavior, or problem) gives me the highest LTV/CAC ratio, and what evidence—actual numbers, not vibes—do I have to back that up?” 2) “Looking at my current funnel, where exactly am I leaking the most value (e.g., low activation, poor retention, weak expansion), and what is one realistic experiment I can launch this week to move a single metric like activation rate or 30-day retention?” 3) “If I capped my payback period at X months (pick a number that’s slightly uncomfortable), which acquisition channels or tactics would I immediately pause or double down on based on their current payback math?”