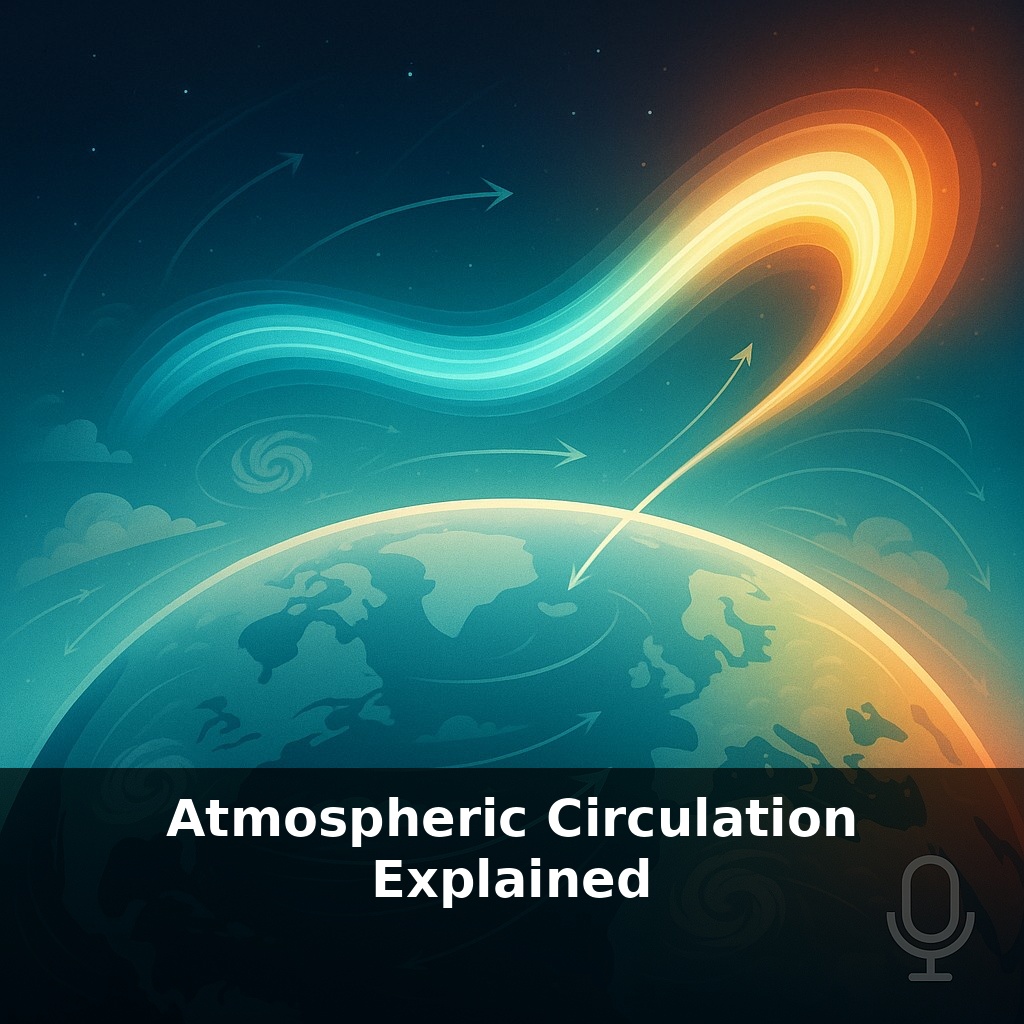
Right now, a river of air is racing high above your head, faster than a hundred miles an hour, quietly steering tomorrow’s weather. In this episode, we drop into that invisible highway and ask: who’s driving it, why does it bend, and how is it quietly rewriting our climate?
That high-speed river of air overhead isn’t just a curious sky feature; it’s the lead conductor of a global orchestra that includes monsoons, desert belts, storm tracks, and even the timing of your local rainy season. Today we zoom out from that single current and look at the whole circulation system it’s embedded in: vast looping flows that rise in the tropics, sink in the subtropics, and shuffle heat and moisture across the planet. These loops decide where rainforests thrive and where deserts lock in, where hurricanes have fuel and where cold outbreaks can plunge south. We’ll see how small nudges—like a patch of warm Pacific water during El Niño—can send ripples through the entire pattern. And we’ll explore why that circulation is slowly shifting in a warming world, inching climate zones poleward and reshaping the weather maps we grew up with.
Think bigger than storms and seasons: atmospheric circulation is the backdrop that sets the stage for everything from crop calendars to flight routes. Airlines, for instance, plan transoceanic paths to hitch a ride on those fast upper-level winds and dodge opposing currents, shaving hours off travel and tons off fuel use. Farmers time planting not just to local rain, but to recurring global patterns that nudge storm tracks north or south. Even wildfire smoke and volcanic ash can piggyback on these flows, crossing oceans and continents, turning distant events into local sky stories.
Start with the big question: why doesn’t the equator just get hotter and hotter while the poles endlessly cool? The answer is that the atmosphere is constantly hauling energy around, and it does it in a surprisingly structured way.
Near the equator, intense sunlight piles up heat. Instead of letting that heat stagnate, the atmosphere moves it: air warms, becomes buoyant, and rises, exporting roughly 90 petawatts of heat poleward each year. That’s about ten thousand times more power than human civilization uses, quietly shipped away from the tropics by moving air and water vapor.
As that air spreads out aloft and cools, it eventually sinks in the subtropics, then returns near the surface, completing what scientists call the Hadley cell. In the mid-latitudes, a different style of circulation takes over. Here, the Ferrel cells don’t behave like neat, self-contained loops. Instead, they’re an average of countless storms and swirling eddies that shuttle warm air poleward and cold air equatorward, like a crowd of people trading seats rather than lining up in an orderly queue. Farther poleward, smaller Polar cells complete the three-cell structure in each hemisphere.
Threaded through the upper parts of these cells are the jet streams, typically roaring along at 150–300 km/h around 9–12 km up. They don’t run as smooth, straight tracks; they snake, buckle, and sometimes split into multiple branches. Those meanders help decide where storm systems grow, stall, or fade.
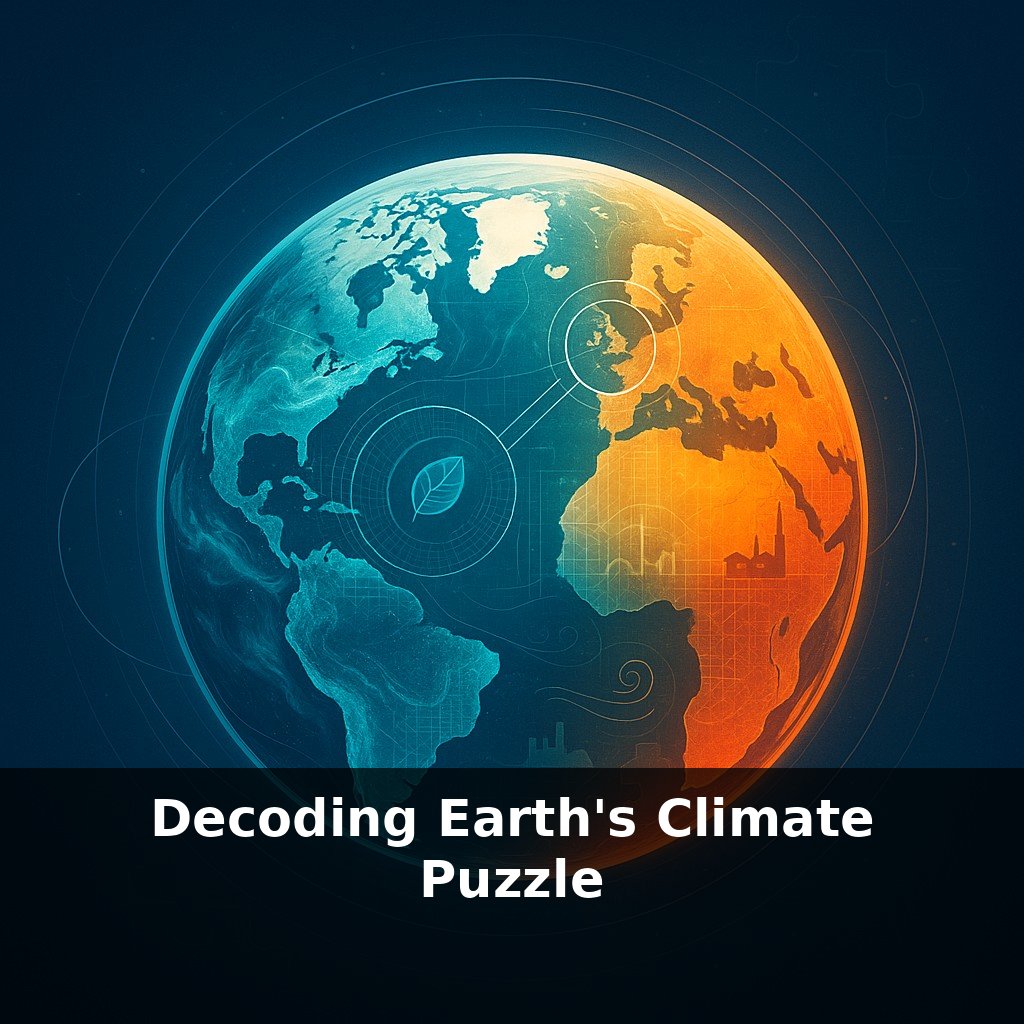
Closer to the surface, the steady trade winds blow from subtropical highs toward the equator. They’re powerful enough to push entire ocean basins, driving currents that, in turn, influence marine ecosystems, fisheries, and coastal climates. During El Niño, when Pacific surface waters warm, the Pacific trades weaken, and this slackening can shift rainfall belts and storm tracks far from the tropics, echoing through monsoons, droughts, and flood patterns worldwide.
All of this is changing subtly. Observations since 1979 suggest the poleward edge of the Hadley cell has nudged about 2° of latitude outward, a shift linked to expanding dry zones and altered storm paths. In other words, the planetary “climate lanes” that agriculture, infrastructure, and ecosystems have long relied on are slowly sliding toward the poles.
Stand on a beach facing west in winter Europe or North America, and you’re reading a live map of atmospheric circulation: each arriving Atlantic storm is a “parcel” handed off along a vast chain that started with rising air over warm waters thousands of kilometers away. The regularity of that chain is why shipping companies schedule crossings in specific seasons and why offshore wind farms cluster along certain coasts: they’re tapping into the preferred storm tracks carved out by those global flows.
Step up to cruising altitude, and pilots treat upper-level charts like artists’ sketches of motion, searching for the tightest strokes where winds align with their route. Catching that narrow band can cut hours off a transoceanic flight; missing it can mean extra fuel and backup airports. Meanwhile, at the surface, dust from the Sahara rides low-level winds to fertilize the Amazon, and smoke from a single wildfire season can tint sunsets on another continent. These are all signatures of the same circulation pattern, stamped onto oceans, forests, and flight logs alike.
Storm tracks and shifting cells quietly redraw human maps. As circulation zones drift, ports may see new fog regimes, ski towns more winter rain, and traditional wind corridors that power turbines can migrate like flocks changing flyways. Your commute, food prices, even the reliability of satellite launches all depend on where these currents choose to flow. Your challenge this week: note every plan you make that assumes the weather will behave “like it used to.”
As you watch clouds race past skyscrapers or mountains snag storms like loose fabric, you’re seeing hints of this vast engine adjusting in real time. Your challenge this week: follow one weather story beyond the headline—trace its origin region, wind path, and impacts. You’re not just checking the forecast; you’re quietly mapping the planet’s pulse.