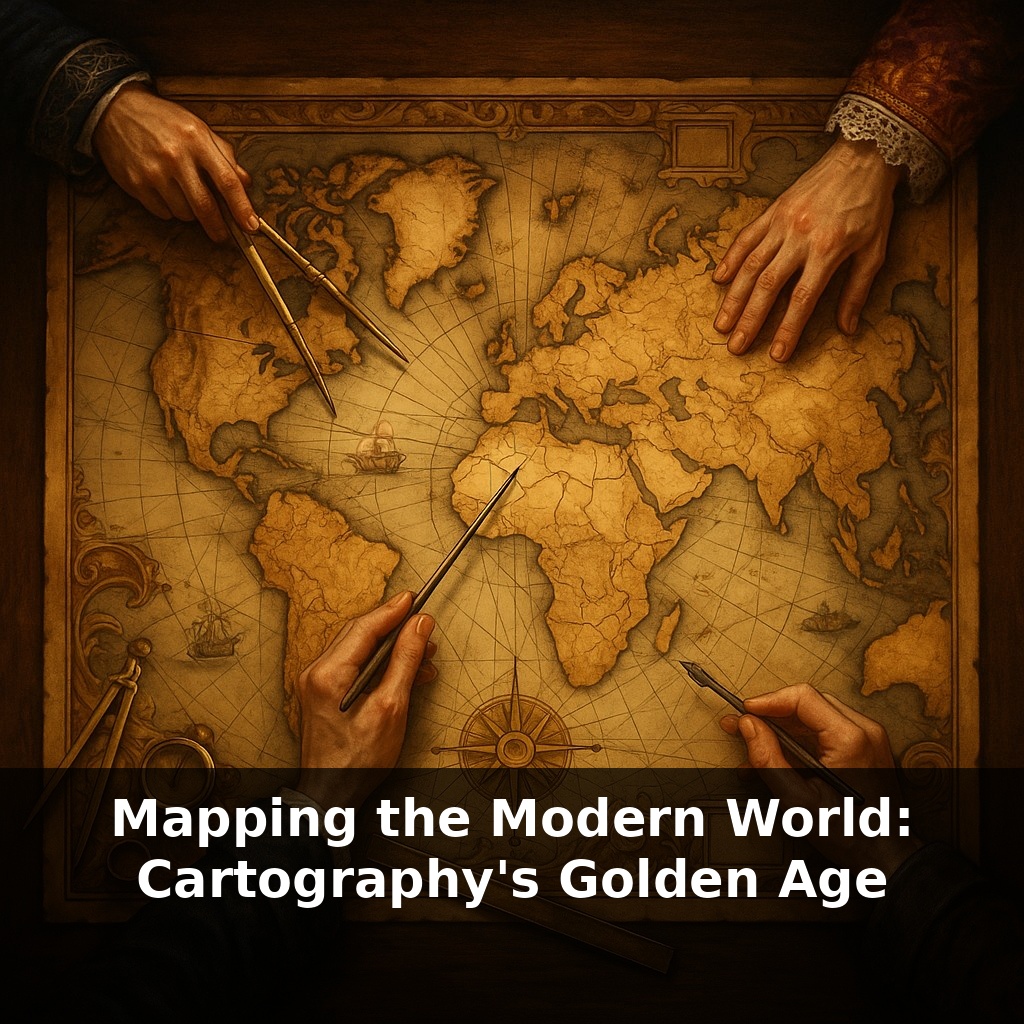
A single map once cost a skilled worker a full year’s wages—yet rulers gladly paid. In one royal chamber, advisors lean over a freshly printed atlas, arguing not about art or science, but where, precisely, their empire now begins…and where someone else’s must end.
Those lavish sheets weren’t just decorations on a study wall; they were decision-making machines. Between 1450 and 1700, European rulers, merchants, and navigators began relying on these images the way modern executives stare at dashboards: to choose routes, risks, and rivals. The shift was abrupt. For centuries, many diagrams of the world had been more like stained-glass windows—symbolic, theological, and unconcerned with strict measurement. Suddenly, numbers and angles mattered.
Printing presses spat out standardized coastlines. Newly recovered ancient texts whispered of coordinate grids and systematic observation. Instruments at sea turned stars into data points. And as voyages pushed farther, each coastline sketched onto paper became both a scientific claim and a political bet, fixing profits and conflicts into ink that could be copied, shipped, and trusted.
Printers, scholars, and sailors were suddenly part of the same project: turning a messy, shifting planet into something you could fold, shelve, and consult. Workshops in places like Antwerp, Amsterdam, and Venice began to feel less like quiet studios and more like early data labs, where new reports crashed into old authorities. One captain’s storm-detour might redraw an entire coastline margin; a merchant’s rumor about a strait could nudge borders on paper. Bit by bit, Europe’s mental picture of “elsewhere” changed—not through one grand discovery, but through constant, contested revision.
Printers didn’t just copy whatever explorers sent home; they had to choose whose version of the world to trust. In the late 1500s, Abraham Ortelius began doing something radical for a mapmaker: he cited his sources. His “Theatrum Orbis Terrarum” quietly announced that no one person owned the truth about the Earth. He pulled together 33 different authors, compared their outlines, and picked winners and losers line by line. Geography was turning into a collaborative, and sometimes competitive, research project.
At sea, the feedback loop tightened. Portolan charts—working documents covered in dense networks of rhumb lines—were refined voyage after voyage until their coastal positions were often accurate to within about a degree of latitude. Captains complained, annotated, and occasionally smuggled copies. On land, mathematicians brought in triangulation: measure one baseline very carefully, then build a whole regional survey from angles. A few well-placed towers and sight lines could pin down an entire province with a precision that would have stunned medieval viewers.
Into this changing toolkit stepped Gerardus Mercator. His famous projection, unveiled in 1569, solved a very practical sailor’s headache: how to follow a steady compass course over long distances. The price was warped areas, especially near the poles, but navigators got something priceless in return—a grid where straight lines matched constant bearings. Later centuries would mine those distortions for ideology, but the original aim was stubbornly technical.
Meanwhile, the business of mapping scaled up. The Blaeu dynasty in Amsterdam turned charts into a global product line, engraving hundreds of copperplates and selling sumptuous compilations that weighed as much as small children. These volumes mixed painstaking measurement with theatrical presentation: ships in full sail, sea monsters near little-known coasts, coats of arms hovering over contested territories. A border thickened by a fraction of a millimeter might translate, in a diplomatic meeting, into a claim over thousands of square kilometers.
All the while, states learned to treat geographic knowledge like an encrypted codebase. Spain and Portugal restricted access to their master charts, aware that a single leaked harbor plan could reroute rival fleets and fortunes. The “known world” of early modern Europe wasn’t just out there, waiting to be discovered—it was negotiated in workshops, guarded in archives, and revised whenever a storm or a skirmish forced the lines on paper to move.
Consider how early buyers used those lavish sheets. A Venetian investor might scan a page the way a startup founder studies an analytics dashboard: searching for under-served routes, risky bottlenecks, and hints of competitors’ next moves. A tiny inlet, barely labeled, could suggest a safer anchorage—and a chance to shave days off a voyage. A decorative cartouche could quietly rename a region, nudging readers to accept a new sphere of influence without a shot being fired.
The workshops behind these images ran on feedback loops. Captains returned with marginal notes; engravers patched plates; publishers issued updated impressions. It resembled a modern software team shipping version 1.1, 1.2, 1.3—each “release” fixing some errors while introducing new controversies. Collectors who owned multiple “states” of the same sheet could literally see knowledge evolve across their shelves, as phantom islands vanished, new passages appeared, and boundaries crept.
Tiny typographic tweaks might decide where merchants sent capital, where preachers sought converts, and where soldiers were eventually dispatched.
Near-future charts will update as quickly as social feeds, stitched from satellites, drones and phones. Bias won’t vanish; it will just shift layers—from projection choice to algorithm design. Whoever controls the defaults quietly frames what looks central or marginal, safe or unstable. Your neighborhood might appear as a blur of delivery routes, a flood-risk heatmap, or a protest hotspot, depending on who is looking. The old struggle over secrecy returns as a debate over open versus proprietary geographic code.
Your screen now plays the role of those guarded cabinets, but with GPS traces and satellite tiles swapping places like players on a field. Every tap contributes a tiny vote about what deserves to be centered or zoomed past. Your challenge this week: compare at least three digital views of the same place and ask, “Who benefits from this version of the world?”