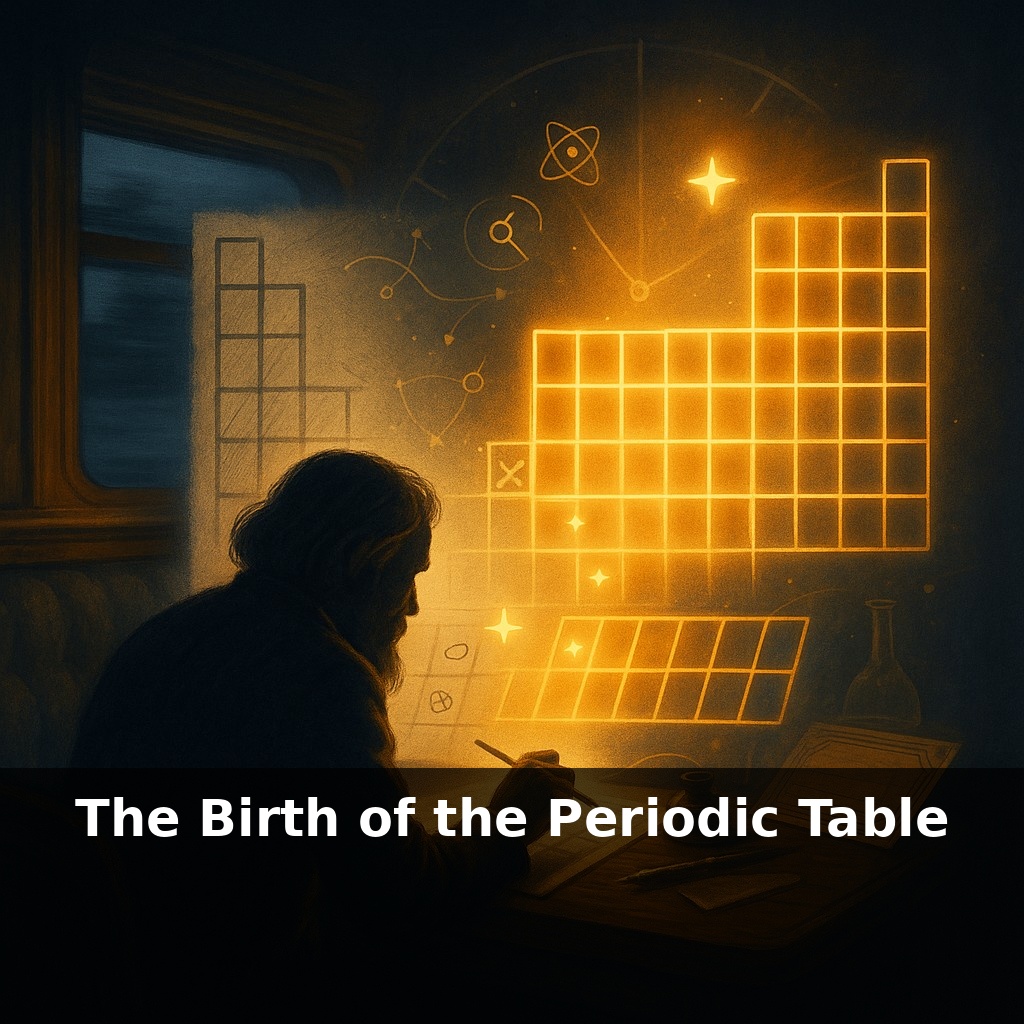
The Birth of the Periodic Table
📝 Transcript
The most important chart in modern science was once drawn on a train ticket by a chemist racing a deadline. He was so sure some “missing” elements would be found that he left blank spaces. Decades later, those spaces were filled almost exactly as he predicted.
Mendeleev’s scribbled sketch didn’t appear out of nowhere; it was the climax of decades of frustration. By the mid‑1800s, chemists had a growing “parts bin” of elements but no instruction manual. Laboratories across Europe were isolating new substances, yet names, symbols, and properties clashed like software written with no shared standard. One chemist’s “family” of elements looked nothing like another’s.
So researchers tried fix after fix—sorting by how elements reacted, by how heavy they were, even by how they looked. Each system worked for a few cases, then collapsed under exceptions. Oxygen and sulfur seemed like siblings, but where did oddballs like tellurium or iodine belong? The puzzle pieces fit locally but not globally.
Mendeleev’s breakthrough wasn’t a single “aha!” moment; it was recognizing that the chaos itself hinted at a deeper pattern waiting to be uncovered.
Chemists before Mendeleev weren’t just confused; they were drowning in data. New elements kept arriving from mines, flames, and strange salts, each with lists of melting points, densities, and reactions that refused to line up neatly. Some, like helium, were first spotted in the Sun’s spectrum before anyone knew they existed on Earth—like a name in a database with no profile attached. Meanwhile, rival “tables” competed in textbooks, and no one could agree which oddities were real elements or just mixtures. The field felt less like a finished map and more like overlapping, contradictory drafts.
Mendeleev’s key move was audacious: he decided that when experimental numbers disagreed with an emerging pattern, the numbers—not the pattern—were probably wrong. That was a radical stance in an era when careful measurements were a chemist’s pride. Yet as he shuffled cards listing each substance’s properties, repeating clusters emerged: similar bonding habits, comparable oxides, shared behavior with acids. When one card stubbornly refused to sit with its apparent “relatives,” he suspected a bad mass value or the presence of an undiscovered neighbor.
Earlier researchers had hinted at regularity. Johann Döbereiner noticed “triads” where a middle substance’s mass sat roughly between two others with similar behavior. John Newlands proposed an “law of octaves,” claiming every eighth substance echoed the one before it, like notes on a keyboard. Both ideas were mocked for oversimplifying, but they planted a seed: repetition might be real, even if the early formulas were clumsy.
What Mendeleev added was flexibility. Instead of forcing a perfect sequence, he tolerated gaps, bumped some substances out of strict mass order, and trusted that future data would either vindicate or falsify his layout. This willingness to let the framework speak louder than any one measurement made his scheme unusually testable. When new discoveries fit the predicted slots, the credibility of the whole structure jumped.
The deeper reason such regularity exists wasn’t understood until the 20th century. Henry Moseley’s X‑ray experiments showed that the crucial count was not “heaviness” but the number of positive charges in the core. That simple integer—atomic number—cleaned up the few remaining misplacements and gave each position a non‑negotiable identity. Later, quantum theory clarified why certain “columns” share behavior: the ways in which negatively charged components fill discrete energy layers create repeating stability patterns.
Today’s layout still isn’t the only way to represent these relationships. Spiral diagrams, stepped constructions, and even 3‑D “buildings” have been proposed to better capture subtle similarities or highlight clusters used in electronics, medicine, or catalysis. Yet Mendeleev’s grid remains the default not because it is final, but because its logic keeps surviving every new test.
Mendeleev’s willingness to leave blanks wasn’t just academic bravery; it turned his table into a prediction engine. When gallium was finally isolated, its low melting behavior stunned experimenters who had never seen a “metal” liquefy in a warm hand—but its measured value landed almost exactly where his notes said it should. That kind of bullseye made chemists treat the layout less like a filing system and more like a research roadmap.
In modern labs, the same logic guides where to hunt for the next superheavy entries: if everything up to 118 fits, the next “address” at 119 isn’t just a fantasy, it’s a target with calculable traits. Quantum calculations now sketch likely stability zones long before anyone synthesizes an atom.
Think of the whole structure like an evolving software API: once the core rules are trusted, developers can safely call functions that haven’t been fully implemented yet, because the interface constrains what those future tools must be able to do.
Soon, chemists may tweak the table the way game designers rebalance a complex strategy game: adjusting where “overpowered” superheavy entries belong as new data comes in. Machine‑learning models are already scouting chemical “maps” no human could draw alone, grouping atoms and compounds by function instead of position. That could steer us toward cleaner batteries, smarter drugs, and reactors that quietly reshape nuclear waste into safer forms.
In that sense, today’s chart is less a finished portrait than a draft blueprint. New isotopes stretch its edges; extreme planets and stellar remnants test which “rules” still hold off‑world. Your challenge this week: whenever you see that familiar grid—in a classroom, lab, or app—ask not “what is this?” but “what might this grow into next?”
From this course

The Elements Under The Microscope
8 episodesUnlock all episodes
Full access to 8 episodes and everything on OwlUp.
Subscribe — $1.99/monthLess than a coffee ☕ · Cancel anytime