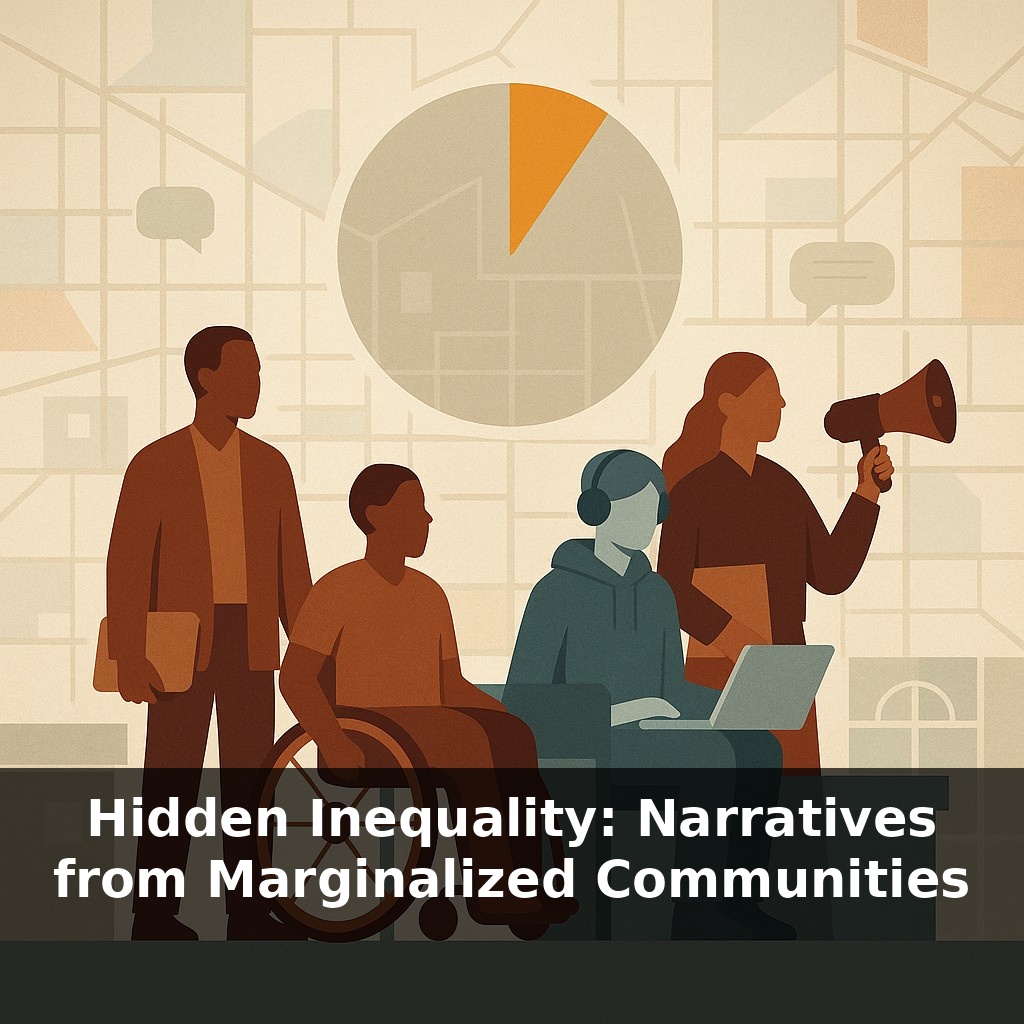
Only a tiny slice of U.S. venture capital ever reaches Black and Latinx founders. Now zoom in: a trans developer sent to “front desk only,” a wheelchair user told the shop’s “not really accessible,” an immigrant organizer silenced in a zoning meeting. Their stories redraw the map of inequality.
“Only 2.6% went to them” is one kind of story. “I never got called back after they saw my wheelchair,” “they loved my idea until they heard my accent,” “the bank said my neighborhood was too risky”—that’s another layer entirely.
On paper, things may look neutral: same job title, same degree, same city. But lived accounts show different corridors behind the same door: some people walk into interviews through a bright lobby, others are quietly diverted to the service entrance. Personal testimonies and community surveys work like high‑resolution lenses, revealing dead ends, side doors, and locked rooms that averages blur away.
In this episode, we follow those finer lines—housing, health, policing, digital access—to see how they intersect, and how communities build their own maps out.
A hidden pattern emerges when we line these accounts up: redlined blocks now facing higher heat, schools next to highways reporting more asthma, “transit deserts” where missing bus lines quietly decide who can keep a job. These aren’t glitches; they’re like default settings baked into the city itself. Add gender, disability, or immigration status and the routes narrow further—fewer banks, fewer clinics, fewer safe public spaces. Yet, in these same places, mutual aid funds rent, neighborhood WhatsApp threads replace 911, and local organizers turn testimony into pressure that city councils can’t easily ignore.
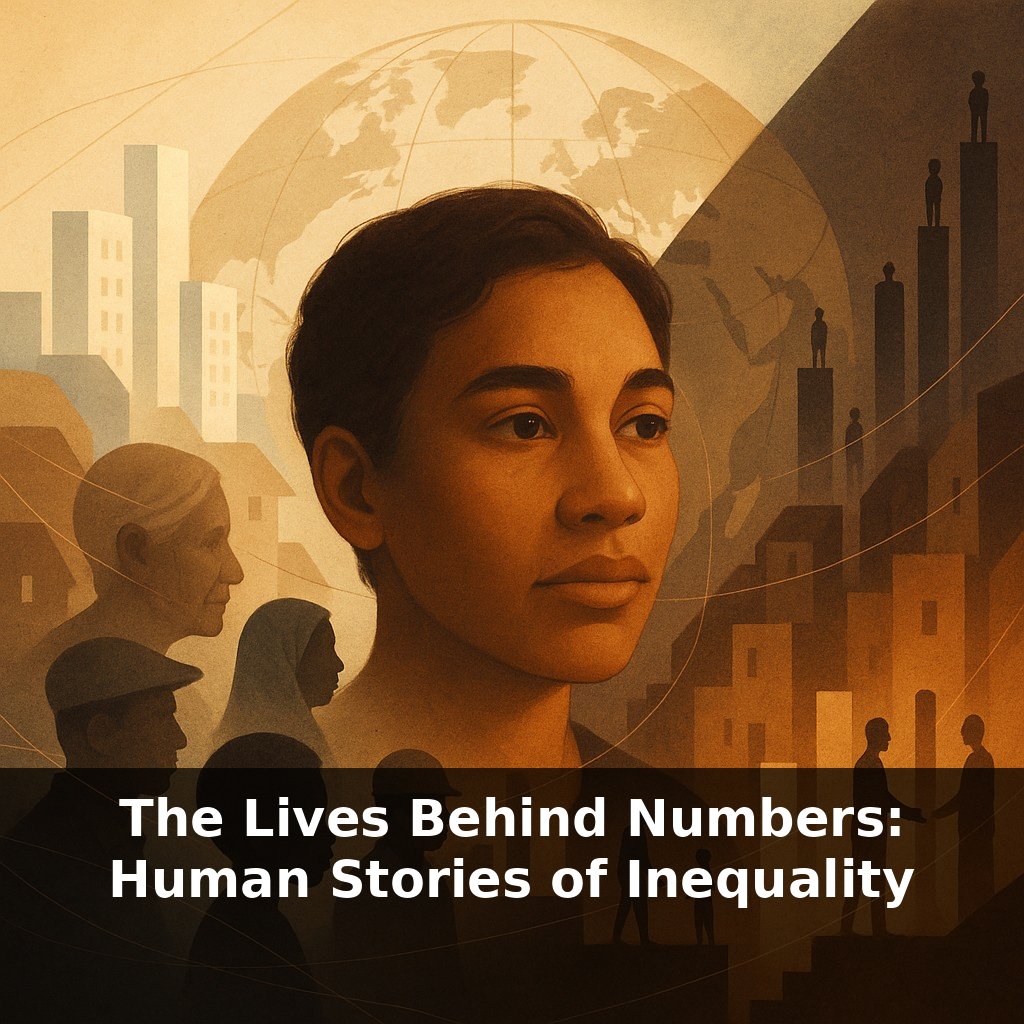
Step past the big numbers and a different dataset appears—one made of bus transfers, missed appointments, skipped meals, and carefully chosen silences.
A queer teen in a rural town clears her browser history after every search about hormones. A deaf customer at a bank lip‑reads half a sentence, guesses the rest, and signs the loan papers anyway. An undocumented cleaner memorizes which streets have the fewest police patrols, even if that adds an hour to her commute. None of this shows up in GDP, yet it quietly governs who feels safe enough to plan for next year instead of just surviving this week.
Ethnographers call this the “everyday life” of inequality: the small, repeated decisions people make to navigate risk. A survey might capture how many households lack formal IDs; interviews reveal the workarounds—borrowing a cousin’s documents, using prepaid phones, hiding cash in cereal boxes because opening a bank account could invite questions. The World Bank can tell us that nearly 70% of the global unbanked adults are women; neighborhood research shows how that plays out as standing in remittance lines at 5 a.m., or relying on informal savings circles that collapse when one member gets sick.
Hidden layers stack. In redlined areas that now run several degrees hotter, asthma rates, utility shutoffs, and summer learning loss combine into a kind of compound interest on disadvantage. For Indigenous women in Canada, disproportionate violence isn’t just a statistic; community testimonies map patterns of police inaction, media neglect, and jurisdictional gaps between federal and tribal authorities. Where official reports list “missing,” families describe years of organizing search parties, poster campaigns, and vigils that double as data‑collection efforts.
Think of these efforts like open‑source software projects: dozens, then hundreds of people debugging a system that keeps crashing on the same users, documenting every error message until the pattern can no longer be dismissed as random.
Yet these same narratives also trace resilience. Mutual aid spreadsheets become proof that formal aid bypassed certain ZIP codes. Court affidavits quoting tenants’ WhatsApp chats reveal illegal evictions. Hashtags collecting thousands of stories—about racist medical care, about disabled riders stranded by “paratransit no‑shows”—grow into shadow archives policymakers now cite.
The misconception that “things are getting better because the averages are improving” falters here. Recent World Inequality Reports suggest global income gaps between countries have narrowed somewhat, but within many nations, wealth has concentrated sharply at the top. Lived accounts help explain why: new jobs emerge, yet hiring algorithms filter out “non‑standard” resumes; more people go online, but platform rules and harassment push some voices back into the margins.
Your challenge this week: treat story‑rich sources as data. Read a local tenants’ union zine, a thread of disability justice posts, or testimonies from a truth commission—not for drama, but like a field report. Ask: What problem is being named here that no official statistic in your last news feed captured?
A neighborhood legal clinic might look like a small storefront, but its intake forms often function like a quiet census. Patterns surface: landlords using the same illegal clause, hospitals “losing” appointments for patients who need interpreters, employers cycling temp workers just before benefits kick in. A youth center’s mural project, when you listen to the stories behind each painted square, can read like an alternative city plan—where bus stops, safe bathrooms, and ramps appear exactly where kids say they’re missing.
Think of a box score from a basketball game: points and rebounds list who scored, but plus‑minus reveals how the team performs when a specific player is on the court. Hidden inequality plays out in that plus‑minus column of daily life. A community fridge log tells you who’s always donating rice and who only ever takes at night. A migrant co‑op’s notebook of shared tools shows who’s excluded from formal credit. These small records don’t just illustrate harm; they quietly draft blueprints for fairer systems.
As governments adopt “smart” systems—credit scoring, welfare fraud analytics, predictive hiring—the next fault line is who gets to design the rules. Hidden biases can be frozen into code, turning past discrimination into tomorrow’s default setting. But the same tools can be flipped: participatory budgeting apps, community‑owned data trusts, and audits of training datasets let marginalized groups edit the script, not just annotate the harm already done.
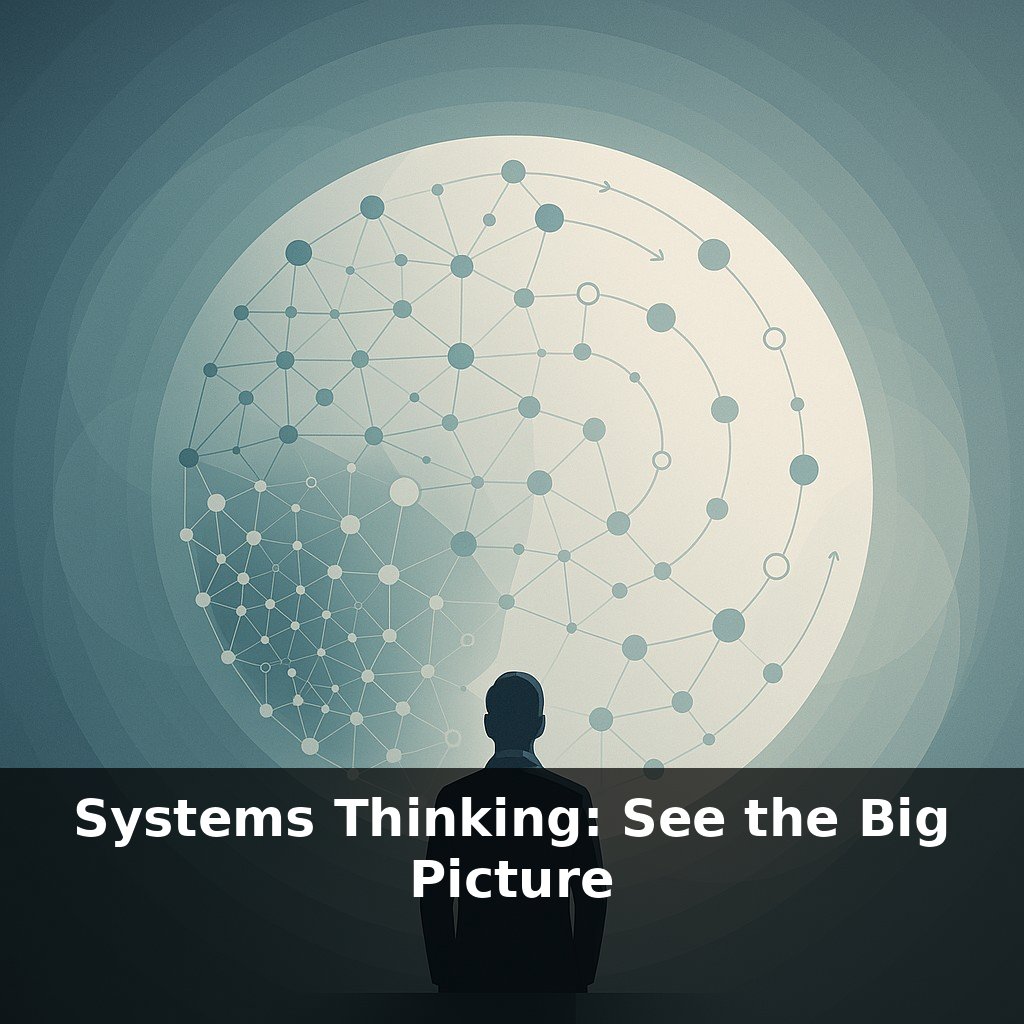
When you listen this way, statistics become coordinates, not conclusions. New questions surface: Who gathered this number? Who was too unsafe or too tired to answer? Like tuning an instrument, the goal isn’t a single “true” note, but reducing the distortion. Follow the faint signals—side comments, silences, jokes—and you start to hear the system hum.
To go deeper, here are 3 next steps: (1) Spend 15 minutes today exploring the **Economic Policy Institute’s “State of Working America” data library** and compare wage, housing, or education disparities for at least two marginalized groups mentioned in the episode, then save 2–3 charts that surprise you. (2) Watch one personal-story film from **The StoryCorps “Justice” collection** or **POV (PBS) docs** that centers a community similar to the guest’s, and jot down the specific policy or structural barrier the storyteller names so you can look it up later. (3) Visit the website of a grassroots group like **Survived & Punished**, **National Domestic Workers Alliance**, or a local mutual aid group highlighted in the episode, sign up for their newsletter, and bookmark their “toolkits” or “resources” page to study how they frame inequality and what concrete campaigns they’re running right now.