Right now, as you’re listening, your phone is quietly firing off millions of tiny yes‑or‑no decisions. No drama, no fanfare—just relentless, microscopic votes. In this episode, we’ll zoom in on one of those voters and uncover how such a simple rulebook powers modern AI.
Those tiny votes don’t happen in a vacuum—they’re grounded in numbers, not magic. At the heart of each decision is a small calculation: several inputs arrive, each carrying a different level of importance, and they get combined into a single verdict. It’s less like a coin flip and more like a careful tally.
To see why this matters, think about recommendation systems: your watch history, time spent on clips, and search terms don’t all count equally. Some signals are amplified, others are barely whispered. A perceptron is where that “whose voice matters more?” logic first becomes explicit.
In this episode, we’ll step inside one perceptron, track what happens from raw numbers to final decision, and see how this humble mechanism became the blueprint for far deeper, more flexible networks.
Machine‑learning researchers in the 1950s weren’t surrounded by GPUs or billion‑parameter models—they were staring at simple datasets and asking a blunt question: “Can a machine *separate* these points into two groups on its own?” That question led to the perceptron, not as a grand AI masterplan, but as a very specific tool: draw a clean dividing line through data. Think spam vs. not‑spam, safe vs. unsafe, approve vs. reject. In this episode, we’re focusing on that narrow talent: how one tiny unit draws a border in number‑space—and where that border inevitably fails.
To get concrete, let’s write down what happens inside that single unit.
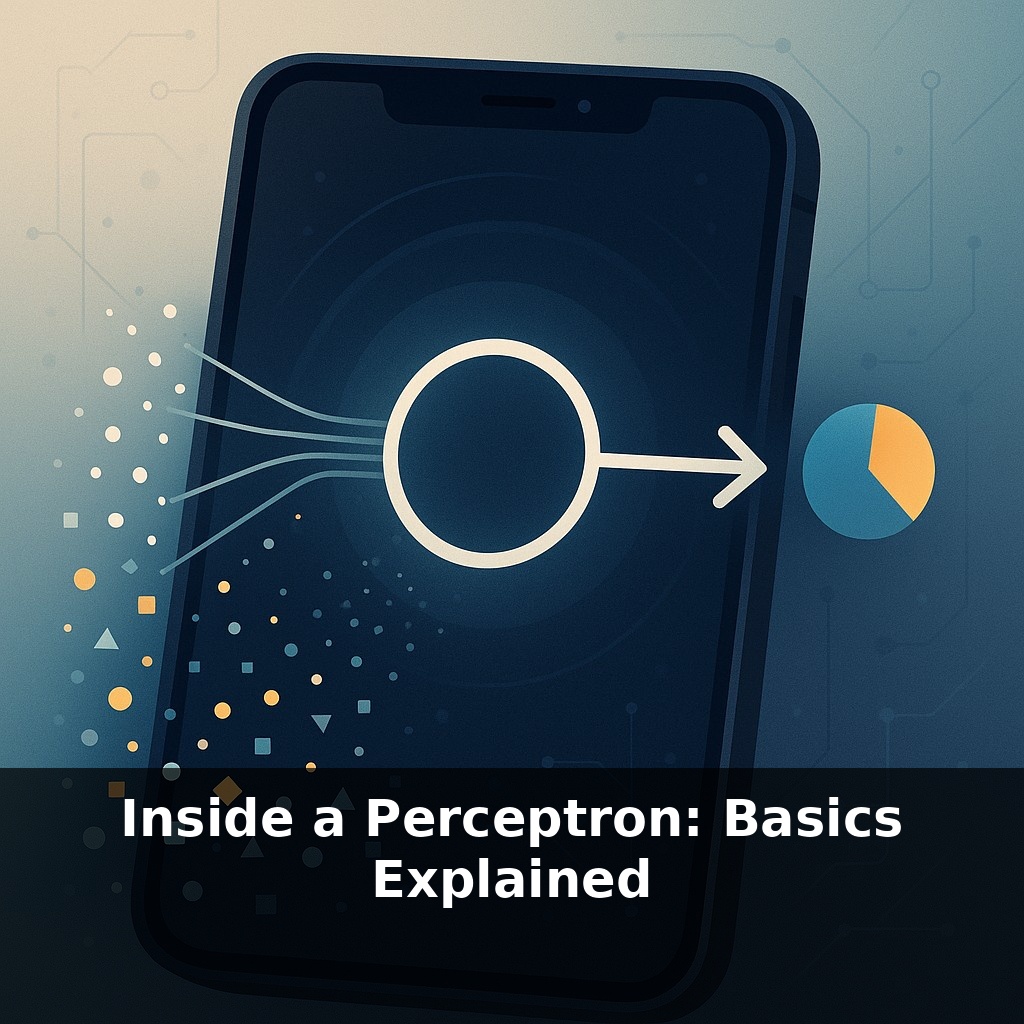
First, each feature in your data is assigned a weight: a number that says “how much should this particular clue sway the verdict?” Height of a transaction amount, time of day, device type—each gets its own dial. There’s also one extra number, the bias, which quietly shifts the whole decision rule up or down. Together, these knobs determine how strict or lenient the unit is.
All those numbers meet in a single computation: they’re combined into one score, then pushed through an activation step that snaps the outcome into a clean 0 or 1. That snapping is crucial; it turns a fuzzy “sort of convincing” score into a firm choice. Historically, this was a hard threshold—above this line, say yes; below, say no.
Training is where things become interesting. We don’t hand‑pick the weights; we expose the unit to labeled examples and let it adjust. Each mistake triggers a tiny correction: if it said “approve” when the truth was “reject,” it nudges weights so that similar future examples move toward the other side of the line. The Perceptron Convergence Theorem promises that, for data that really can be split by some straight boundary, this nudging will eventually find one.
That straight boundary is the key geometric picture: one unit can only carve space with a flat cut. As soon as the pattern you want bends—like the classic XOR arrangement of points in opposite corners—you hit a wall. No matter how long you train, a single flat cut can’t cleanly separate them.
Yet this modest tool scales. Stack many such units into layers, and you’re suddenly drawing intricate, folded boundaries in high‑dimensional space. Each added layer recombines earlier outputs, assembling more complex shapes. Modern GPUs exploit this by crunching billions of these small operations in parallel, turning what was once a single line on a 2D plot into vast, multi‑layered decision surfaces that power image recognition, translation, and more.
Your challenge this week: pick one everyday binary filter you rely on—spam folder, fraud alert, or login security—and ask, “Could a single straight boundary in feature space really separate its yes from its no?” Then, dig: what extra clues or twists would *force* that system to go beyond one flat cut?
Think about how a bank screens loan applications. One bare‑bones setup might focus on just three numbers: income, existing debt, and credit score. A single perceptron can treat those like coordinates and carve a flat decision surface: one side means “approve,” the other “deny.” That works decently when higher income, lower debt, and better credit almost always align with safer borrowers.
Now change the rules. Suppose the bank adds a startup founder with low salary but high equity, or a retiree with strong savings but no current income. Suddenly, the neat, flat split starts to fail: “risky” and “safe” applicants weave around each other in ways that can’t be handled by a single tilt of the plane.
Here’s the twist: early credit‑scoring systems were closer to that flat cut, based on a few hand‑crafted rules. Modern risk engines layer many such units, each specializing in patterns—frequent small purchases, unusual travel, timing quirks—letting the overall model follow the tangled contours of real financial behavior instead of forcing a single, rigid boundary.
As hardware shrinks and spreads, this old idea quietly gains new jobs. Tiny models on wearables or home sensors can lean on perceptron‑style units to flag anomalies right where data is born, without phoning the cloud. In policy circles, the appeal is different: a single, transparent boundary is far easier to audit than a maze of hidden layers, so it becomes a reference point when regulators ask, “How simple *could* this decision rule be—and what extra complexity are we really buying?”
Zooming out, that lone unit is less a relic and more a seed. The same math now runs in camera autofocus, on‑device dictation, even tiny chips in appliances quietly tuning power use like a smart thermostat adjusting heat. As we stack and shrink these units, the open question becomes: how simple is “simple” enough for decisions that shape real lives?
To go deeper, here are 3 next steps: 1) Open a free Google Colab notebook and literally code a single perceptron from scratch (no libraries) using the perceptron learning rule; if you need a guide, follow along with Section 1–2 of Nielsen’s *Neural Networks and Deep Learning* (online, free) where he walks through neurons as weighted sums plus activation. 2) Play with an interactive perceptron visualizer like TensorFlow Playground (playground.tensorflow.org): set it to a single neuron, toggle activation functions (step vs. ReLU vs. tanh), and watch how changing a single weight or bias rotates/translates the decision boundary. 3) Grab the classic Iris dataset from scikit-learn, train a Perceptron model (`sklearn.linear_model.Perceptron`), then print and inspect the learned weights and bias so you can connect each number directly to how the neuron is separating one flower class from the others.