About half of people told they have pre-diabetes never regularly check their blood sugar—then feel “blindsided” when it turns into type 2. You’re rushing to work, grab a “healthy” breakfast, and by mid-morning you’re exhausted. Today, we’ll unpack what your meter isn’t telling you.
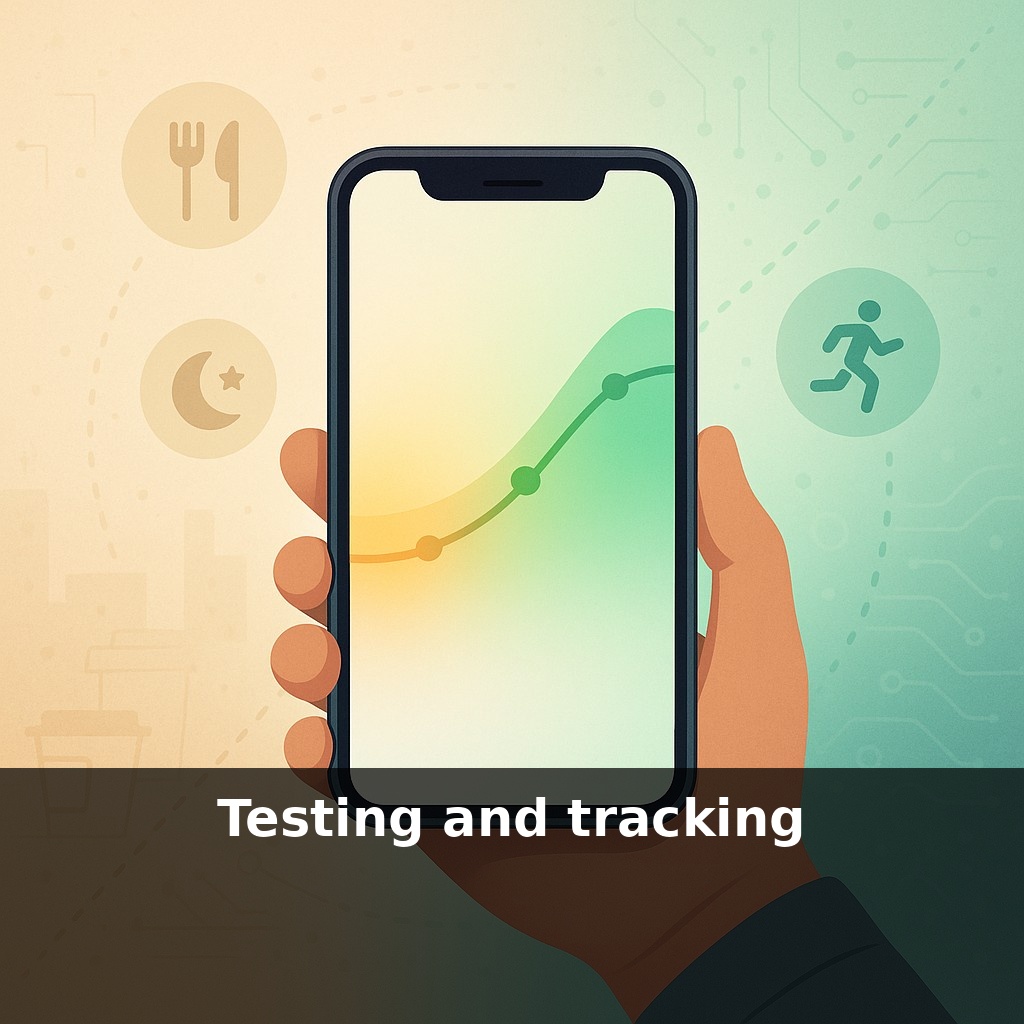
Roughly 90 out of 100 adults with pre-diabetes already carry the most powerful lab tool in their pocket: a smartphone. Yet fewer than 20 use it to track glucose, food, sleep, or movement in a consistent way. That gap matters. In large studies, people who logged their habits and numbers cut their risk of progressing to type 2 by up to 68 %. Think of what that means in daily life: catching a recurring 170 mg/dL spike after your “normal” lunch, or seeing that 15 minutes of walking after dinner drops your next reading by 20–30 points. Modern sensors, apps, and cloud dashboards can now connect these dots in real time, instead of waiting three months for your next lab slip. In this episode, you’ll learn how to turn simple readings into a feedback loop—so each week your data quietly nudges you closer to normal glucose, instead of slowly drifting the other way.
Here’s the catch: lab work every 3–6 months can’t show you that your Tuesday-night pasta pushes you to 165 mg/dL, while Friday’s stir-fry keeps you at 125. Two people can share the same HbA1c, yet one may hit 140 after meals and the other 200—a 60‑point difference with very different long‑term risk. That’s where home testing and digital logs matter. Modern finger-stick meters now meet an accuracy standard of about ±15 % for most readings, and CGMs can add 2 extra hours per day in a healthy range. Pair either with an app, and you can tag food, sleep, and stress so patterns pop out in a week, not a season.
The first step is deciding **what** to track and **how often**—not “forever,” just enough to map your personal patterns.
For most people with pre‑diabetes, there are three practical setups:
1. **Finger‑stick only, 2–4 checks/day for 10–14 days** This is the lowest‑cost option. A simple starter pattern looks like: - Day 1–3: one reading on waking, one 2 hours after your largest meal - Day 4–7: add a pre‑meal reading before that largest meal - Day 8–14: keep the same times, but on two days per week add a reading before bed That gives you roughly 30–50 data points in two weeks—enough to see if you’re usually under 140 mg/dL at 2 hours, or routinely spiking to 160–180.
2. **Short‑term CGM, 10–14 days** With a sensor, you don’t need to poke your finger to see the impact of specific meals or late‑night snacks. Instead of staring at every data point, focus on three numbers in the app or reader: - Percent of time between 70–140 mg/dL (higher is better) - Highest peak in the 3 hours after meals - Overnight stability (do you stay roughly in the same 20–30‑point band?)
3. **Hybrid: meter + periodic CGM** Some clinics now loan sensors for 2 weeks, then have you switch back to a meter. That brief “deep dive” can guide your routine spot‑checks for the next 2–3 months.
Next, you need a **simple structure** for notes. In whatever app you use, create just four tags to start: - Meal type (e.g., “oats/fruit,” “rice/bread,” “eggs/veg”) - Portion size (small / medium / large) - Movement (0, 10, 20+ active minutes in the 3 hours after eating) - Sleep quality (good / okay / poor)
Within a week, you might notice patterns like: - “Medium rice bowls” → 2‑hour readings around 165–175 - “Eggs/veg, 10 minutes walking” → 2‑hour readings around 115–125
That difference—50+ points from ordinary‑seeming choices—is where you find leverage.
Think of the process like tuning an instrument: each small adjustment (less starch at dinner, 15 minutes of walking, earlier bedtime) slightly changes your “sound.” Your numbers tell you, within 1–2 days, whether that tweak moved you closer to your target band.
To keep it sustainable, limit yourself to **one active experiment per week**: - Week 1: adjust one meal (e.g., swap your usual lunch for a lower‑starch version 5 days in a row) - Week 2: add a 10–15 minute post‑dinner walk on 4 evenings - Week 3: aim for a consistent sleep window, then see what happens to your morning reading
You’re not chasing perfect graphs; you’re collecting **just enough data** to decide which 2–3 habits give you the biggest drop with the least effort.
A practical way to see this in action is to walk through two different weeks.
Person A checks a few times at random. They see 132, 154, 118 mg/dL with no context. Hard to act on. The same person, using tags for just 7 days, ends up with a mini “story” instead of scattered numbers:
- Monday: 2‑hr after “oats/fruit, large, 0 min” → 168 - Wednesday: 2‑hr after “eggs/veg, medium, 10 min” → 124 - Friday: 2‑hr after “rice/bread, large, 0 min” → 182
By the weekend, it’s obvious which meals to shrink and which to repeat—no guesswork, no complex math.
Now layer in CGM for 10 days. The app shows time between 70–140 rising from 58 % to 68 % when dinners stay under 40 g of starch and include a 15‑minute walk. That’s about 2.4 extra hours per day in a safer band—roughly 17 extra “good hours” per week—just from one pattern change you can actually see on your screen.
Your challenge this week: pick one meal, log it the same way 5 times, and let the numbers vote on whether it stays, shrinks, or gets swapped.
In the next 3–5 years, expect your tracking tools to “think” alongside you. Algorithms will flag meals that push you over, say, 160 mg/dL more than 30 % of the time and suggest specific swaps before you eat. Non‑invasive sensors could let you check 20 times a day with zero finger‑sticks. At clinic visits, shared dashboards may highlight which 2–3 habits cut your average peaks by 20–30 mg/dL, so visits become strategy sessions, not lectures.
Next, shift from “tracking” to “targets.” Ask your clinician for clear numbers: for example, 80–110 on waking, under 140 at 2 hours, and at least 16 of 24 hours in-range if you use a CGM. Then let your apps grade each day: green when you hit ≥70 % of goals, yellow at 50–69 %, red below that. Aim to turn 2–3 red days per week into green.
Before next week, ask yourself: 1) “If I treated my life like a science experiment, what’s one specific variable I’d test this week—sleep time, caffeine, social media, or workout timing—and what exact ‘data’ (energy level, focus, mood, output) will I track each day to see if it actually helps?” 2) “Looking at my current goals, where am I guessing instead of measuring, and what simple number or metric could I start tracking today (e.g., minutes of deep work, number of outreach messages, reps/sets, revenue per day) to see if I’m moving the needle?” 3) “What’s one assumption I’ve been treating as ‘truth’ (like ‘I’m not a morning person’ or ‘I can’t focus more than 20 minutes’) that I’m willing to deliberately test this week, and how will I know—from my own data—not just my feelings—whether it’s actually true?”