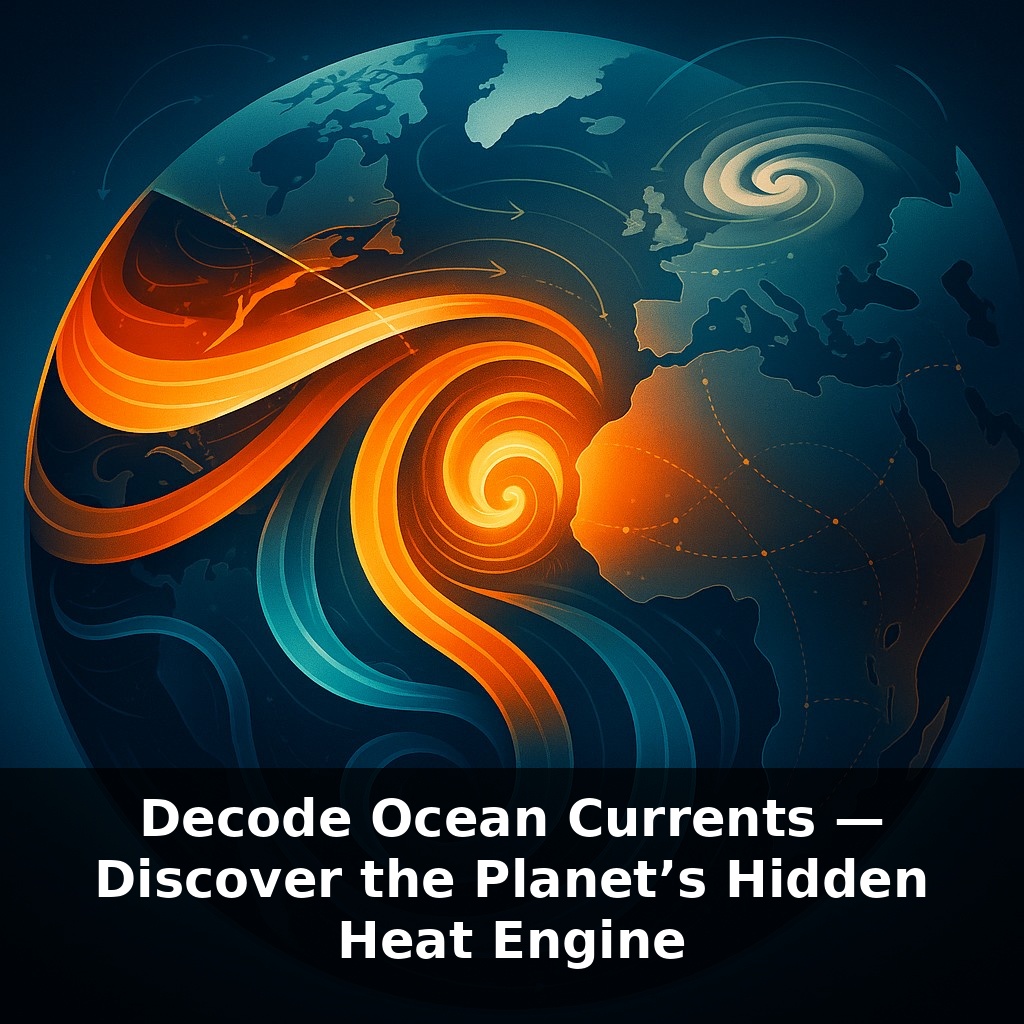
Some of the hottest water on Earth is hidden deep in the ocean, steering winter storms over cities thousands of kilometres away. A gust of wind in the tropics today can tilt next year’s heatwave in Europe. Let's dive into the ocean's hidden networks, where currents weave tales of ancient climates and modern mysteries.
Some of the heat now pulsing through the North Atlantic began its journey before the printing press existed. Water that once touched Antarctic sea ice is quietly gliding a kilometre beneath your feet right now, carrying the climate’s long‑term memory. This isn’t slow in the way a lazy river is slow; it’s slow like a medical drip that, over hours, completely transforms what’s happening in the body.
Follow that flow and you meet a heavyweight: the Gulf Stream, funnelling about 150 million cubic metres of water every second. That power helps keep winters in Western Europe far milder than places at the same latitude in Canada.
But instruments moored across the Atlantic are telling us something unsettling: this vast system is weakening. Not crashing, not stopping—but faltering. In this episode, we’ll decode what that means for storms, sea level, and the stability of the climate we’ve built our cities around.
As those Atlantic instruments keep listening, they reveal an even larger story: currents are part of a planet‑wide trade in heat and salt. Warm, salty surface waters flow poleward; colder, heavier waters sink and slide back toward the tropics in the deep, connecting basins that seem separate on a map. Along the way, these flows decide where fisheries thrive, where fog clings to coasts, and how quickly ice at the poles melts. Just as a small tweak to a recipe can change an entire meal, tiny shifts in temperature and salinity can, over time, reshape weather patterns thousands of kilometres away.
Beneath the busy surface, that global loop behaves less like a single current and more like a network with chokepoints and shortcuts. One of the biggest chokepoints sits in the Labrador and Nordic Seas, where surface waters interact with cold air and sea ice. There, water masses can abruptly flip from floating to sinking, forming dense plumes that plunge hundreds of metres in a seasonal “waterfall.” These sinking regions are limited in area, but they are gatekeepers: they help set how much heat the North Atlantic can swallow each year.
That matters because the upper 2 000 metres of the ocean have quietly taken in the vast majority of extra planetary heat in recent decades. When we talk about global warming, we often picture air temperatures, but the ocean is where ~90 % of the excess energy actually goes. Each year of added heat doesn’t just make the surface a bit warmer; it can thicken warm layers, push stratification higher, and make it harder for deeper, colder waters to mix upward. In turn, that can starve some regions of nutrients normally brought up from below, and shift entire marine food webs.
Freshwater from melting ice and intensified rainfall adds another twist. As Greenland’s ice sheet and Arctic sea ice lose mass, pulses of fresh water spread across the North Atlantic surface. Fresher water is less dense, so it resists sinking even when cooled. That can reduce formation of deep waters at those northern chokepoints, nudging the overturning circulation weaker—exactly what long‑term measurements in the Atlantic now suggest has been happening since the mid‑20th century.
The consequences are uneven. Along the U.S. East Coast, a slackened overturning tends to pile more water against the shoreline, raising regional sea level beyond the global average. Across the Atlantic, changes in heat distribution can alter storm tracks, influencing where intense winter systems form and how far they reach inland. Tropical rain belts can shift by tens to hundreds of kilometres, redistributing drought and flood risks for millions. And because the deep limbs of this circulation take centuries to complete a loop, any change we trigger now will echo through the climate system for generations, long after today’s weather has been forgotten.
Stand on a beach and watch the shoreline curve: those bends and hooks often trace where currents deliver or steal sand, quietly reshaping real estate maps. Ship captains know this intimately; shaving days off trans‑Atlantic routes by riding narrow, fast‑moving bands of flow is a form of applied oceanography. Coastal fog, too, is a surface hint of deeper patterns: where cold upwelled water meets moist air, harbours can vanish behind a white curtain while inland skies stay clear.
Marine life follows these highways. Sardine runs off South Africa, anchovy booms off Peru, and rich cod grounds in the North Atlantic all sit where currents squeeze, split, or rise. When those pathways meander or stall, fisheries quotas, food prices, and even political decisions feel the tug. Climate scientists now treat these flows almost like vital signs in medicine: continuous monitoring, searching for subtle arrhythmias that signal a system under stress, long before a dramatic shift appears in the headlines.
Shifts in these flows won’t just tweak weather maps; they could rewrite calendars and harvests. Monsoon timing, hurricane paths, even when ski seasons start may all drift as heat and salt pathways adjust. Ports might schedule departures like surgeons booking operating rooms, targeting narrow windows of favorable current “vitals.” Your local forecast could one day lean on live ocean data as heavily as it now does on satellite clouds, fusing sea and sky into a single, evolving outlook.
As instruments sharpen and models evolve, we’re only just learning how these flows sync with ice sheets, forests, even city energy use. Your challenge this week: whenever you see a weather map, mentally sketch the hidden currents beneath it. Then ask: if these paths bend or stall, which habits in my own life would suddenly feel out of season?