Only about a third of big, famous psychology results held up when tested again. Yet companies like Google quietly run careful experiments that generate hundreds of millions of dollars. In this episode, we’ll explore why most ideas fail when tested—and how to design ones that don’t.
Most bad experiments don’t fail because of bad ideas; they fail because we ask the question in a sloppy way.
Change three things at once, measure vaguely, peek at the data every hour, and suddenly you can “prove” almost anything—until someone repeats your test and gets the opposite result. That’s how teams ship features that quietly hurt engagement, or launch “successful” ad campaigns that actually lose money over time.
In this episode, we’ll move from “trying things and seeing what happens” to testing ideas in a way your future self—and your boss or collaborators—can trust. We’ll look at how to:
- Turn fuzzy hunches into clear, testable predictions - Decide what *not* to change so results mean something - Use randomization, blinding, and replication outside the lab
So your next experiment doesn’t just look rigorous—it *is* rigorous.
In real projects, the hard part isn’t knowing that you *should* run a good experiment—it’s wrestling with messy realities. Your sample size is tiny, stakeholders want answers yesterday, users keep changing their behavior, and you can’t freeze the whole system just to test one idea. Under that pressure, it’s tempting to quietly relax your standards: tweak multiple things at once, accept noisy metrics, or stop early when results “look good enough.” This is where rigor either survives contact with the real world—or collapses into wishful thinking dressed up as data.
Start with the pieces you *can* control: the variables.
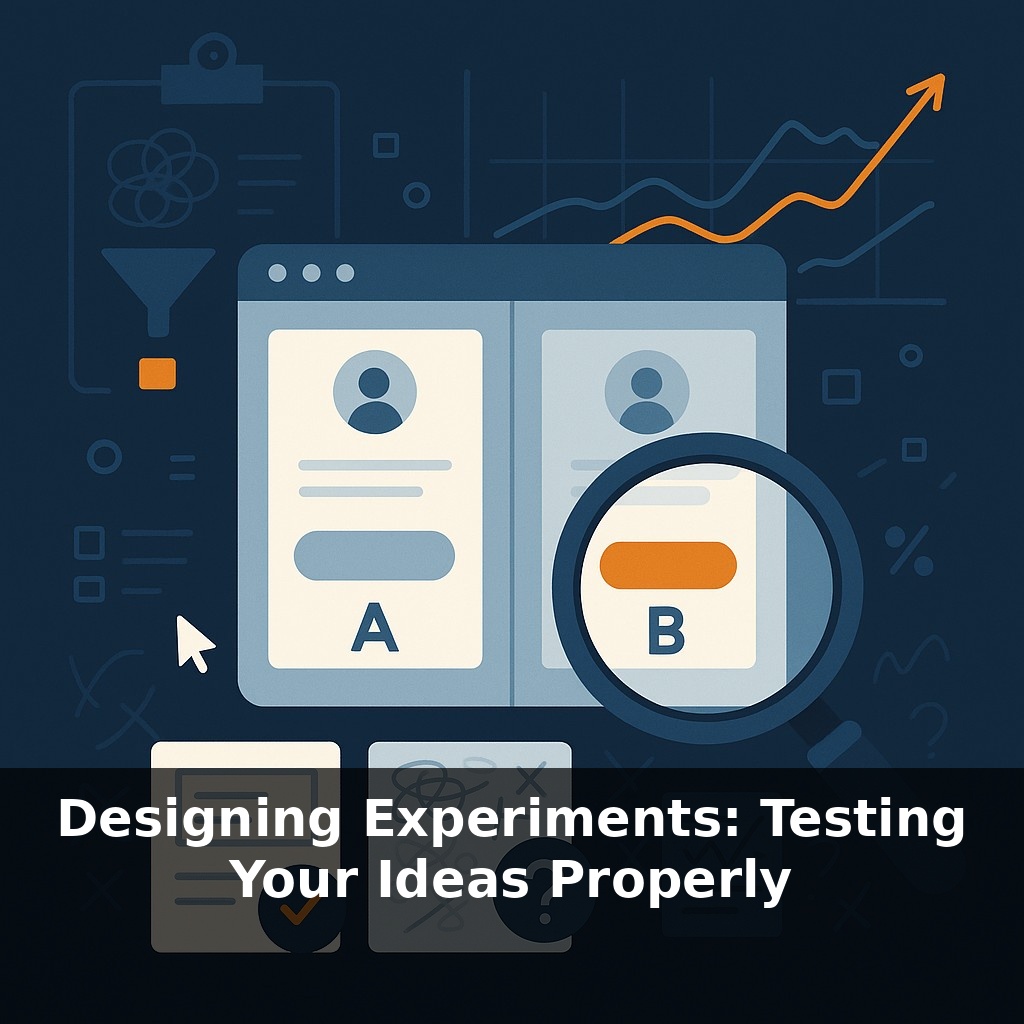
First, choose your independent variable: the one lever you’ll deliberately change. Make it as concrete as possible: “discount = 10 % vs 20 %,” “headline A vs headline B,” “notification at 9 a.m. vs 5 p.m.” Vague levers (“make page cleaner”) splinter into many invisible changes, and you’ll never know which one mattered.
Next, pin down your dependent variable: the outcome that decides the verdict. You want something close to the real goal, but also fast and cheap to observe. A health startup might care about 12‑month outcomes, but use 4‑week blood markers as a first screen. A product team might care about revenue, but use 7‑day activation as an early proxy. Name *one* primary outcome before you start; everything else is supporting evidence, not the headline.
Now, identify the troublemakers: potential confounders. These are factors that could change *with* your lever and also push the outcome. Time of day, user segment, sales region, device type, previous exposure to your feature—list anything that could plausibly tilt the result. You won’t eliminate all of them, but you can often:
- Hold them fixed (e.g., only test on new users) - Balance them (e.g., equal mix of mobile/desktop on each version) - Measure them (so you can adjust or at least interpret carefully)
Then address power. Instead of “we’ll see what happens,” decide what effect size would actually matter. Doubling revenue is unrealistic; a 2–5 % lift might be both meaningful and believable. Use that target, plus your typical variability, to estimate how many observations you’d need for about 80 % power. If you can’t reach that, either narrow your question (focus on a more responsive segment) or treat the study as exploratory, not confirmatory.
Finally, plan your decision rule *in advance*. Examples:
- “If version B improves 7‑day activation by at least 3 percentage points with p < 0.05, we’ll ship it to all new users.” - “If we don’t see at least a 10 % reduction in error rate, we’ll drop this algorithm and explore alternatives.”
This pre‑commitment protects you from mid‑stream story‑editing when early numbers look exciting (or disappointing). It also makes your work reproducible: someone else could follow the same steps and understand exactly how you reached your conclusion.
Your challenge this week: pick one real decision you’re facing and write down, in advance, your lever, primary outcome, main confounders, power target, and decision rule—*before* you look at any new data.
A cardiology team doesn’t jump straight from a hunch to prescribing a new drug. They start with a small, tightly controlled trial on patients who meet very specific criteria, focusing on one measurable outcome—say, blood pressure change after 8 weeks. Only if that looks promising do they expand to a larger, more diverse group to see whether the effect holds up in messier, real‑world conditions. You can mirror that structure in your own work. Think of a “Phase 1” test as checking whether your idea does *anything* detectable under ideal conditions; a later “Phase 2/3” style rollout asks whether the result survives contact with different teams, markets, or platforms. Like following a precise cooking recipe where you change just one spice, then invite blind taste‑testers, you’re stacking the deck in favor of honest answers instead of flattering illusions.
In the next decade, running careful tests may feel less like a special project and more like checking the weather: tools will quietly suggest hypotheses, flag weak designs, and simulate outcomes before you touch real data. AI copilots could auto‑draft protocols, pre‑registration may be baked into lab software, and citizen scientists might join in from their phones. The skill that matters most won’t be pushing buttons, but asking sharp questions those tools can actually answer.
Careful testing isn’t just for labs or giant tech firms; it fits into daily choices too. You can A/B your workout plans, compare two sales scripts, or trial different study routines, treating each as a small field test. Progress then becomes less about heroic intuition and more about a steady series of bets where each round teaches you something you can actually trust.
To go deeper, here are 3 next steps: 1) Open up Notion or Airtable and build a simple experiment tracker with columns for hypothesis, metric, sample size, variant A/B, and outcome—use the free “Experiment Tracker” template in Airtable’s gallery to get started in under 10 minutes. 2) Watch Google’s free course “A/B Testing by Google Analytics Academy” and, while you’re watching, set up a real A/B test (e.g., headline or CTA button) in Google Optimize or VWO on a landing page you already have live. 3) Grab a copy of “Trustworthy Online Controlled Experiments” by Ron Kohavi and read just Chapter 2 today, then translate one principle (like defining a single primary metric) into a concrete rule you’ll add to your experiment tracker as a required field.