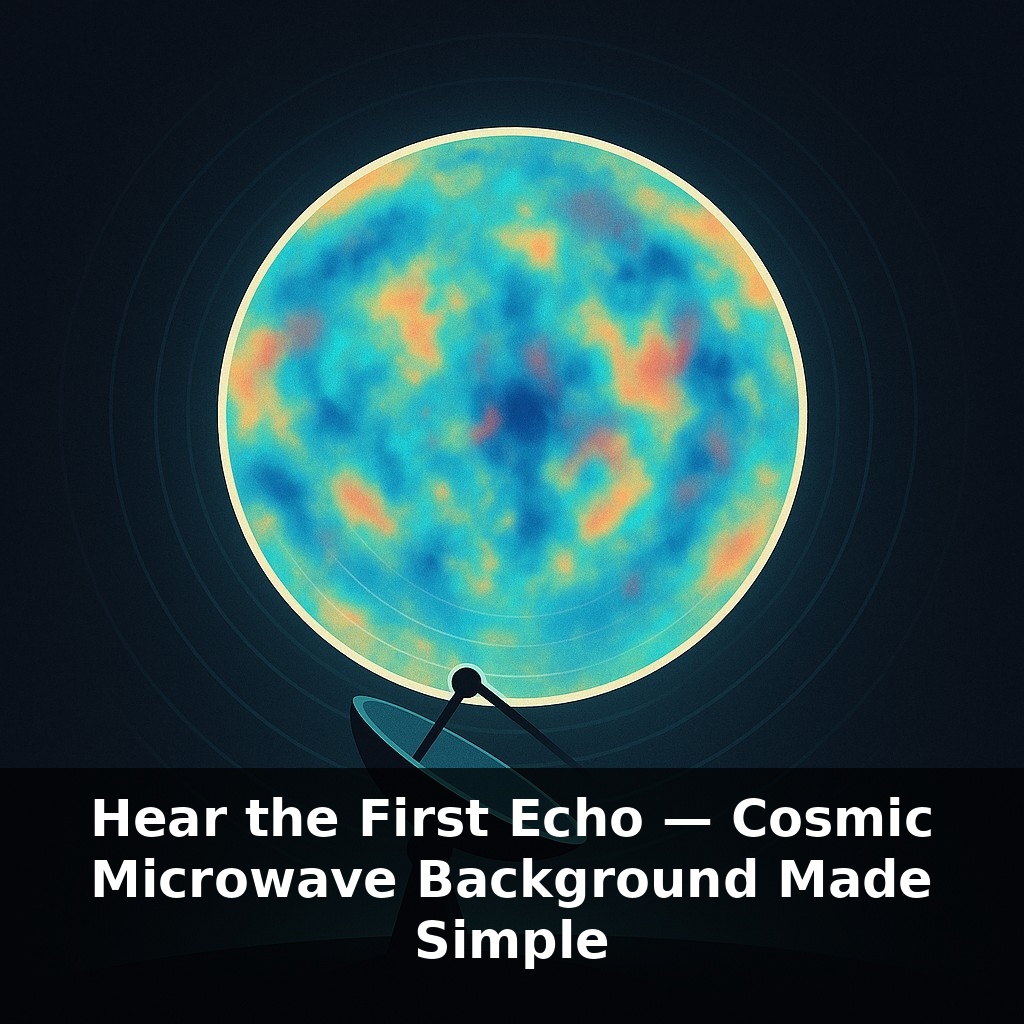
Right now, the quietest sound in the universe is a faint radio hiss coming from every direction in the sky. Astronomers say this glow is older than the first stars, older than any galaxy—yet we only learned to “hear” it in the last few human lifetimes.
That faint radio hiss astronomers tune into isn’t just “background noise”—it’s precision data. Hidden in that glow are temperature ripples only about one ten‑thousandth of a degree different from place to place, yet those tiny wrinkles sketched the blueprint for where matter would pile up and where it would thin out. In earlier episodes, we zoomed in on exoplanets, galaxies, and even the dark scaffolding that holds the cosmic web together. Now we’re stepping back—far back—to a time when none of that structure had formed yet, and the universe was more like a simmering cosmic fog just starting to settle. The patterns in the CMB tell us how lumpy that fog was, how fast the universe was expanding, and even how much of it would become atoms, dark matter, or dark energy. In this episode, we’ll learn how “listening” carefully to that ancient echo lets us reconstruct almost everything we know about the universe’s origin story.
The strange part is that this glow doesn’t just tell us *what* the early universe looked like; it tells us *how* it behaved. By measuring the CMB’s precise temperature across the sky, missions like COBE, WMAP, and Planck turned a fuzzy backdrop into a detailed map of cosmic conditions: how fast space was stretching, how curved or flat it is, and even how many particles of light existed for every particle of matter. Those numbers are so sharp that changing them slightly would rewrite everything—from how quickly the first stars ignited to whether galaxies like the Milky Way could form at all.
Think of this as zooming in on that “baby picture” to the point where individual pixels start to matter. Each hot or cold patch in the CMB isn’t just a color on a map—it corresponds to a specific physical effect we can decode.
Some patches look slightly warmer because of tiny sound waves—literal pressure waves—ringing through the primordial plasma before it cooled. Gravity tried to pull matter into denser regions, while radiation pressure pushed back, setting up oscillations. The sizes and heights of these oscillations show up today as a series of peaks in the CMB power spectrum: a graph of how strong the fluctuations are on different angular scales across the sky. That pattern of peaks is one of cosmology’s sharpest measuring tools.
From the first peak, we infer the geometry of the universe: if space were strongly curved, the characteristic “acoustic” scale would appear distorted. Planck’s measurements show it lines up with a universe that’s extremely close to spatially flat. Higher peaks tell us how efficiently ordinary matter and dark matter participated in those oscillations. Ordinary matter interacts with light, so it rides the sound waves; dark matter mostly doesn’t, so it acts as extra gravitational weight. Comparing their imprints lets us pin down the ratio that led to the familiar 4.9% vs 26.2%.
The overall smoothness of the map, plus the exact strength of the smallest ripples, reaches back even further—to fractions of a second after the Big Bang. Many models of inflation predict a nearly scale‑invariant pattern of fluctuations, and that’s essentially what we see. We also look for polarization patterns: twisting “B‑modes” in the CMB’s polarization could betray primordial gravitational waves from inflation itself. So far, foreground dust has complicated that search, but the method is clear.
Finally, the CMB doesn’t just tell us about the past. As its photons cross billions of light‑years, they pass through evolving structures. Slight energy shifts encode how fast cosmic acceleration is stretching space today, giving an independent handle on dark energy beyond what we get from supernovae or galaxy surveys.
Musicians sometimes study the vibrations of a drum to infer its shape and material; cosmologists do something similar with the CMB’s pattern of fluctuations. Instead of tuning forks and microphones, they use satellite maps and statistical tools to extract “notes” like the Hubble constant, the age of the universe, and the balance of different energy components. One payoff: by combining CMB results with galaxy surveys from Episode 6, we can test whether gravity behaves exactly as Einstein predicted over cosmic distances. Another: comparing CMB‑derived expansion rates with those measured from supernovae exposes today’s “Hubble tension,” a growing discrepancy that might hint at new physics such as evolving dark energy or extra light particles in the early cosmos. Future observatories—like CMB‑S4 and LiteBIRD—aim to sharpen polarization measurements, potentially revealing signatures of primordial gravitational waves and narrowing the space of viable inflation models from a zoo of ideas to a manageable shortlist.
The CMB doesn’t just close the book on the Big Bang; it keeps adding footnotes. As new missions sharpen its map, they might expose tiny mismatches with our best model—like a song that’s just slightly off‑key. Those glitches could point to hidden particles, unexpected twists in gravity, or hints that dark energy evolves with time. Your challenge this week: when you see a “precise” number in science news, ask what hidden ripples it might be quietly revealing.
By tracing how that faint glow is bent, blurred, or dimmed by intervening clusters, we can weigh cosmic structures and test whether gravity ever “changes key” over time. Upcoming surveys will cross‑match CMB maps with lensing, neutrino counts, and gravitational‑wave events, turning one ancient signal into a whole orchestra of new cosmic checks.
Here’s your challenge this week: Build a “mini CMB experiment” at home by recreating how scientists first detected the cosmic microwave background. Today, use a metal coat hanger or simple antenna, plug it into an old TV or radio (or watch a video demo if you don’t have one), and actually observe the static that partly comes from the CMB’s ancient signal. Then, sketch or screenshot what you see and label which part represents that leftover glow from 380,000 years after the Big Bang. Finally, explain the experiment in a 60‑second voice note or video as if you’re the scientist announcing the CMB’s discovery to a friend.