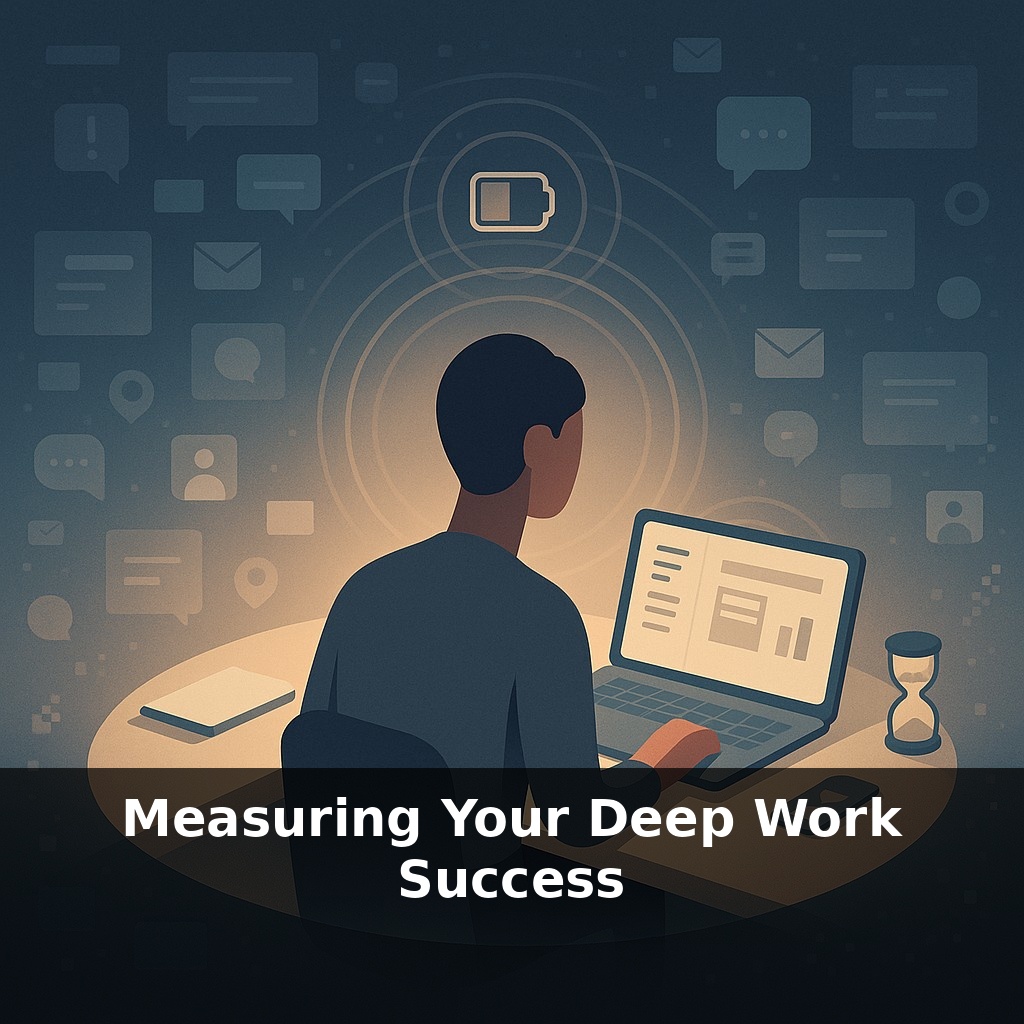
Most people think they know how productive they are. Yet studies show the average knowledge worker changes digital windows over a thousand times a day. You sit down to “focus,” and hours vanish—emails, pings, tiny detours. But how do you actually know if deep work happened?
Developers who batch their notifications finish pull requests about 50 % faster. That isn’t because they suddenly code twice as well; it’s because they’ve changed *how* they measure and protect their best attention. The same applies to writers, designers, analysts—anyone whose work depends on thinking clearly for stretches of time. The trap is that most of us still judge our days by how “busy” they felt: number of meetings, length of the to‑do list, how drained we are by 6 p.m. Busy feels like progress, but it’s a terrible scoreboard. In this episode, we’ll shift from fuzzy impressions to concrete signals: clear ways to see whether your focused hours are actually translating into valuable output, and how subtle tweaks—like when you schedule intense work or how you recover between sessions—can quietly multiply what you get done.
So instead of asking “Was I productive today?”, we need sharper questions: *What exactly did I ship? When was my thinking clearest? What consistently derailed me?* This is where measurement stops being a guilt trip and starts becoming a navigation system. Think of your day like a studio with multiple rooms: one for hard thinking, one for admin, one for rest. Right now, most of us keep sprinting between rooms without noticing. By tracking a few simple signals—when you enter, how long you stay, and what leaves with you—we can map your real deep‑work pattern instead of guessing.
Here’s the twist: “Did I focus?” is the wrong question. The questions that matter are closer to: *What did my best hours actually produce?* and *What conditions reliably create those hours?* To see that, you need two scoreboards running in parallel: one for **output**, one for **process**.
On the output side, think in terms of **high‑value units** specific to your craft. For a developer, that might be merged pull requests that required real problem‑solving, not cosmetic tweaks. For a writer, drafted or edited pages that moved a project meaningfully forward, not inbox triage. For a designer, approved concepts or iterations that survived critique. The key is that these units are *cognitively expensive* and clearly tied to progress. You’re not counting every keystroke; you’re counting the pieces of work that actually change the state of a project.
On the process side, you’re asking: *What did it cost my brain to create those units?* Here, three signals matter:
1. **Time in true focus** – uninterrupted blocks where you stuck to one demanding task. You don’t need second‑by‑second tracking; even a simple log—start time, end time, task—reveals a pattern over a week.
2. **Depth of immersion** – your subjective sense of “how far under” you went. A quick way to capture this is a 1–5 rating right after a session. Over time, you’ll see that some environments, times of day, or rituals produce more “4s and 5s” with less strain.
3. **After‑effect** – how you feel 30–60 minutes later. Sharpened? Flattened? Mildly wired? That’s your nervous system reporting back on whether the load was sustainable.
Now you can combine the two scoreboards into simple ratios: “high‑value units per focused hour,” or “average depth rating for sessions before noon vs. after.” Instead of guessing when you’re at your best, you’re quietly running experiments.
This is where tools become useful, not oppressive. A time‑tracker that distinguishes “deep project X” from “shallow admin,” a kanban board that shows which tasks only move during certain hours, a code or document history that reveals when substantial changes cluster—each is just another way of making your invisible patterns visible.
Over a month, these traces start to tell a story: which projects genuinely benefit from deep sessions, how many such sessions you can sustain, and where your effort is leaking into distraction. You’re no longer measuring how hard the day *felt*; you’re measuring how precisely your effort turns into finished, meaningful work.
A practical example: a freelance illustrator notices that finished client‑ready panels only appear in bursts. For two weeks, she logs start/end times for her hardest drawing passes, rates immersion, and notes which panels get approved without major revision. The pattern surprises her: the most “keeper” panels happen in two morning blocks, and they almost never follow late‑night sketching. So she carves out a 9–11 a.m. “no‑chat, no‑email” studio slot and shifts rough ideation to afternoons. Within a month, her revision rounds drop, and she quietly takes on an extra project without working later.
A small engineering team does something similar with a sprint: they tag tickets that genuinely required original solutions, then compare when those tickets moved versus when chat volume spiked. The result: two maker mornings per week with muted channels. Their cycle time for the hardest tickets shrinks, but meeting hours don’t change—only *when* they happen does.
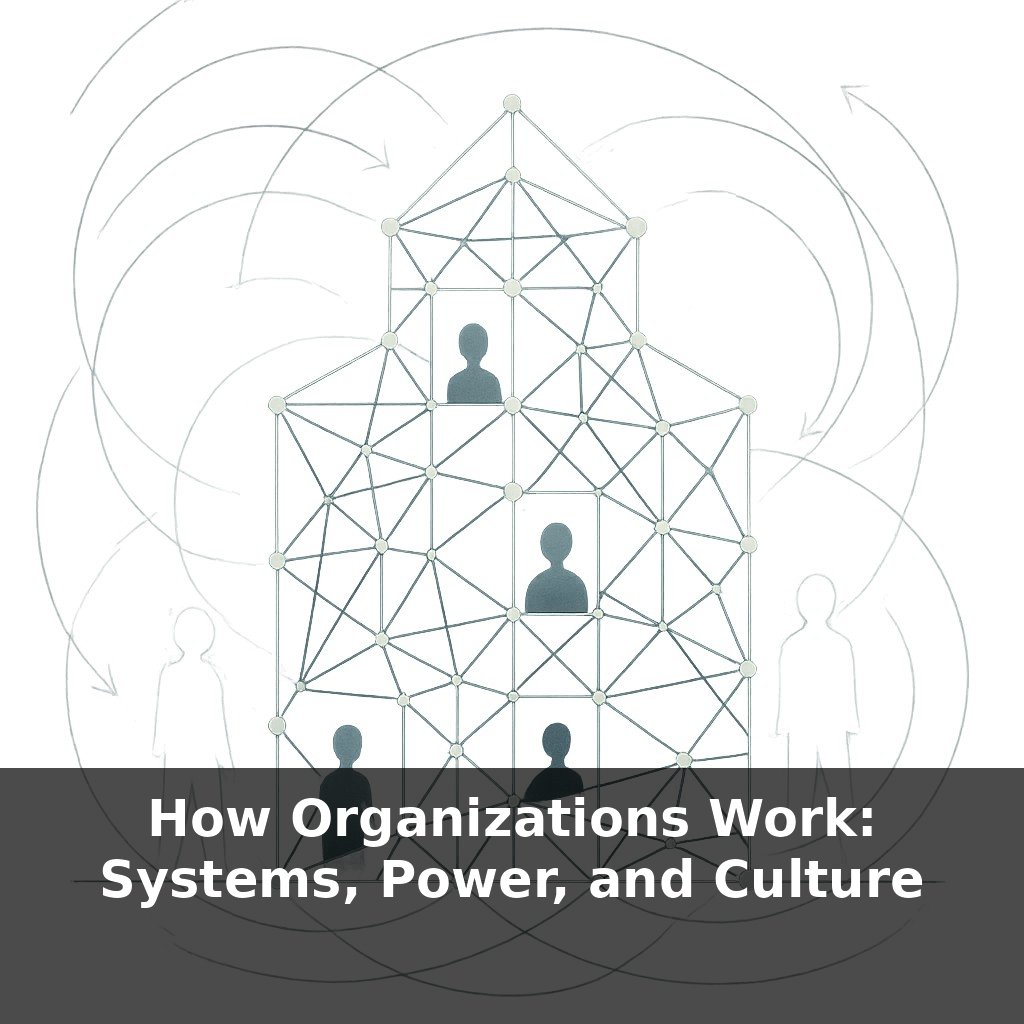
A quiet shift is coming: as tools start scoring cognitive load in real time, your calendar may look less like a grid of meetings and more like a heat map of prime mental territory. Instead of arguing about who’s “working hardest,” teams could tune workloads like sound engineers—raising complexity for someone in a peak zone, lowering it for someone mentally jet‑lagged. The risk is obvious: crude scorecards. The opportunity is subtler—crafting roles around each person’s most powerful hours.
Treat these measures less like a report card and more like a sketch you keep revising. Over time, you may notice certain collaborators, tools, or even playlists consistently lift your best work. Patterns like these can nudge career‑level choices—what projects you say yes to, which skills you double down on, and where your clearest contributions truly lie.
Here’s your challenge this week: Pick one deep work metric from the episode (for example: number of 60–90 minute deep work blocks, words coded/written, pages read, or problems solved) and track it for five consecutive days. Each morning, schedule at least one deep work block on your calendar with a clear target tied to that metric (e.g., “2 pages of the report drafted” or “3 algorithm problems completed”). At the end of each block, log your actual result next to your target, and on day five, compare your targets vs. results and decide one concrete tweak you’ll make to your deep work setup for next week.