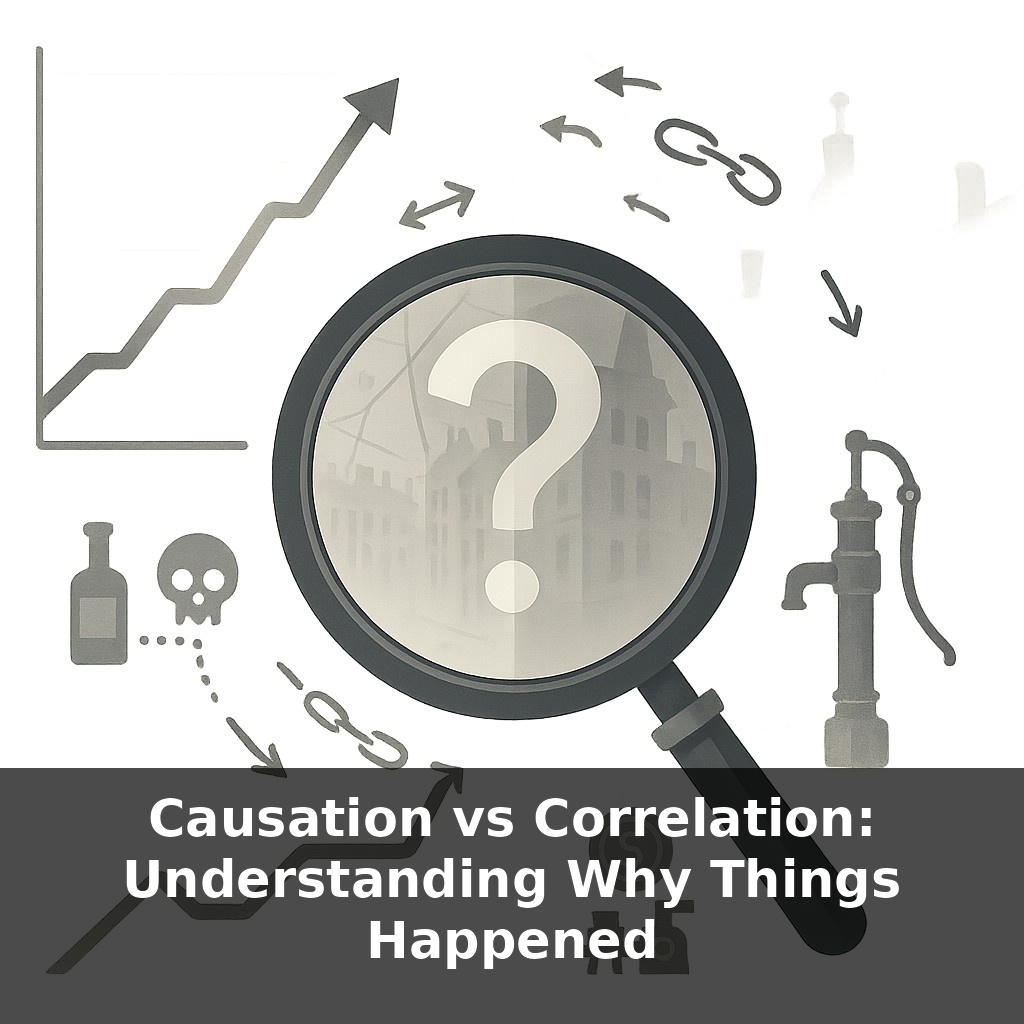
One of the most dangerous sentences in history is: “The numbers speak for themselves.” A city bans alcohol and deaths fall. A factory upgrades machines and profits rise. A new policy starts and crime drops. But here’s the twist: all three stories can be true—and still not be causal.
Here’s where thinking like a historian gets interesting: you almost never get to run the perfect experiment. You can’t rewind the 1854 cholera outbreak and try it again without removing the pump handle. You can’t re‑run Prohibition in a parallel United States where the law never passed. Yet historians still make strong claims about why things happened: why revolutions ignite when they do, why empires collapse, why social movements suddenly gain traction after years of failure.
To do this, they lean on patterns across time and space: comparing similar cities with different laws, tracing sequences of events, and hunting for plausible mechanisms in letters, speeches, and statistics. You’ll notice they ask not just “what changed?” but “what else changed at the same time—and who benefits from which story of cause and effect?”
Historians also worry about false trails. Some patterns are like storm clouds that only *look* connected from where you stand: a revolution and a bad harvest, a new law and a sudden drop in crime, a war and an economic boom. The trick is deciding which pairings are meaningful and which are coincidences. That’s where counterfactuals—reasoned “what if this key piece had been different?” questions—come in. By imagining nearby worlds with one element changed, then checking those against other cases and sources, historians pressure‑test whether a factor was truly doing causal work or just passing through the scene.
So how do historians actually move from “this pattern looks interesting” to “this factor helped drive what happened”? They borrow tools from places you might not expect: statistics, epidemiology, even economics—but adapt them to messy human stories.
One move is to ask: if this relationship is real, *how strong and how consistent is it* across different cases? That’s where something like the correlation coefficient is a first probe, not a verdict. A near‑zero value might look like nothing is going on, but historians know to check whether the link could be curved, delayed, or only active beyond a threshold. A price spike might only spark riots once wages fall below a certain line; a political speech might matter only in provinces where a party network already exists.
They also care deeply about *sequence*. Austin Bradford Hill’s “temporality” idea—cause has to come before effect—gets translated into close timelines: which law passed first, when pamphlets circulated, how fast rumors traveled. Sometimes the ordering alone overturns a beloved story: if urban crime was already falling years before a new policy, that policy doesn’t get to take full credit.
Another move is comparison. The Broad Street pump story is dramatic, but it’s only truly persuasive when set next to other outbreaks in other cities with different water systems. Similarly, the re‑analysis of Prohibition used some states as rough “controls” to see how alcohol‑related deaths shifted where restrictions bit harder versus where they were weaker. The point isn’t to find a perfect twin world; it’s to ask, “When this factor changes more here than there, do outcomes shift in parallel?”
Historians then layer in mechanisms and motives. If a government insists a policy saved lives, they look for hospital records, private memos, opposition newspapers. Who gains from claiming X caused Y? Who quietly disagreed at the time? Causal stories are political assets; tracking who spends them is part of the evidence.
And crucially, they almost never stop at a single driver. Instead of hunting for *the* cause of a war or reform, they sketch a bundle: structural pressures, triggers, and amplifiers. A bad harvest might raise tension; a new ideology might supply language for anger; a specific riot might light the fuse. The work is to show how those strands interlocked—not to crown one of them the sole author of history.
Think about how you’d debug a mysterious glitch in a kitchen, not a computer. You wake up to find bread burned every morning. You don’t assume “new toaster = burnt toast” and walk away. You vary one thing at a time: same bread, different slot; same settings, different outlet; same routine, different pan. Over a week, you might notice the toast only burns when the oven is preheating for something else—the heat nearby is nudging the thermostat. That’s how historians treat puzzling turns in the record: they look for quiet background “ovens” warming the scene, not just the obvious gadget in the foreground.
Take a wage protest that erupts right after a tax hike. Instead of stopping at “new tax, new riot,” a careful study might track food prices, harvest reports, police staffing, even payday schedules. If other towns with the same tax but cheaper grain stayed calm, that contrast becomes a clue. The craft is less like solving a single whodunit and more like running a series of small kitchen experiments, watching which ingredients really change the dish.
A century from now, students may test claims about today’s crises the way chefs tweak recipes: swapping one ingredient at a time in simulated timelines. As archives digitize everything from text messages to satellite images, small shifts—like local flood rules or school funding formulas—will be easier to isolate. That power cuts both ways. Selective graphs can harden myths fast, so civic debates will hinge on who can show not just striking curves, but responsibly argued “why” stories behind them.
Treat every tidy “X caused Y” headline like a recipe you didn’t watch being cooked. Ask: what was left out, who picked these ingredients, and what other dishes turned out differently nearby? Your challenge this week: when you see a persuasive chart or slogan, sketch two rival stories that could also fit the same pattern—then hunt for evidence that separates them.