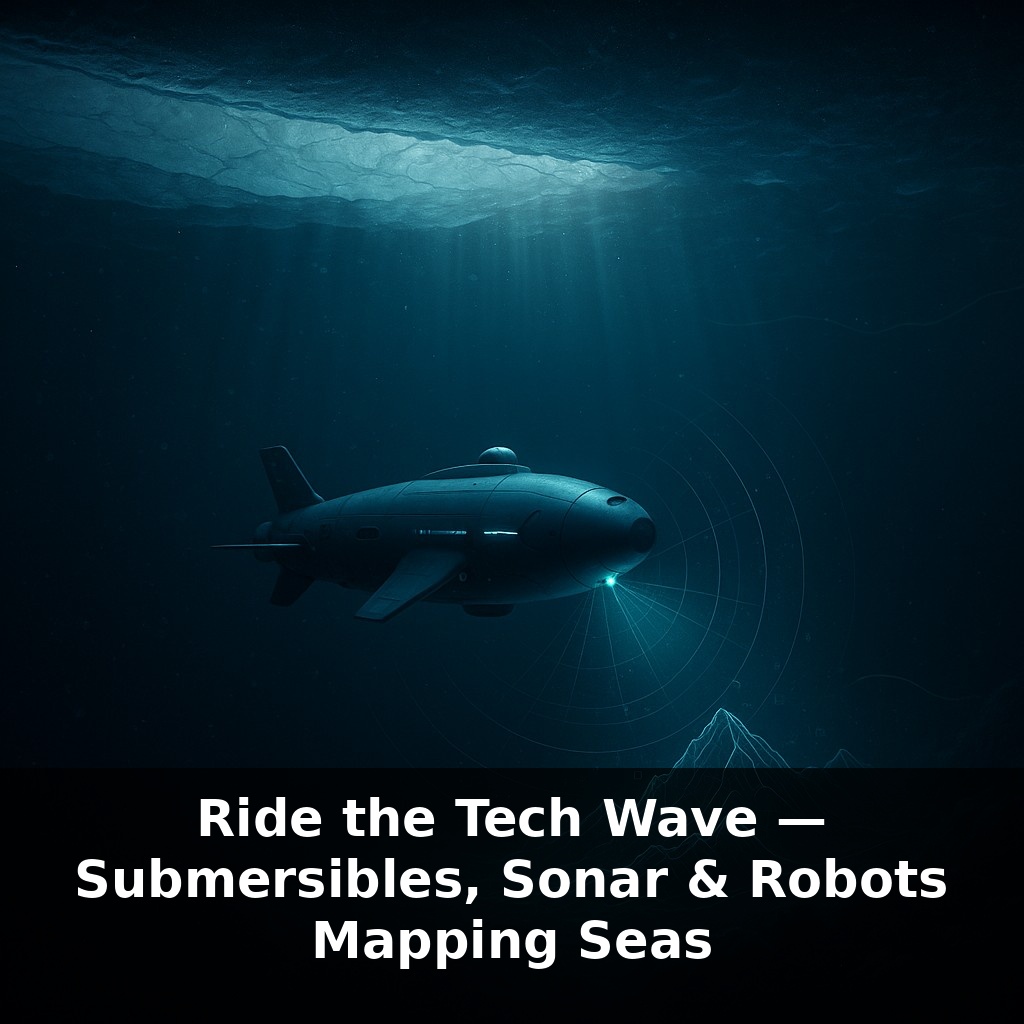
Right now, a robot the size of a small car is gliding under black Arctic ice, “seeing” a mountain range no human has ever mapped. No lights. No GPS. Just sound, pressure, and code—quietly turning blank blue on our maps into a detailed 3‑D world.
At the surface, we navigate with satellites, lighthouses, and coastlines we can see. Below a few dozen meters, all of that disappears—and yet engineers are now threading fiber‑optic cables across entire oceans and landing them within meters of their targets. The trick is a new toolbox of submersibles, sonar, and seafloor‑hugging machines that treat the deep not as a void, but as a landscape full of usable detail.
In earlier episodes, we focused on the life that thrives there; this time we’re following the gear that lets us “survey” their world. High‑resolution multibeam sonar sweeps let us chart submarine canyons and hidden volcanoes almost as precisely as city streets. AUVs and crewed craft return with seafloor mosaics so sharp you can trace individual ripples in the sand. Bit by bit, the blank spaces on ocean charts are turning into working maps scientists, ship captains, and coastal planners can actually use.
But mapping the seafloor is only half the story; the real leap is that these systems can now sense *change*. Modern instruments don’t just trace mountains and trenches—they log temperature, chemistry, currents, and even tiny shifts in the crust itself. A single dive might return data on methane seeps, landslide‑prone slopes, and habitats we never knew existed. Engineers pack more sensors into smaller frames, like cramming an entire weather station into a thermos. Linked together, fleets of vehicles can resurvey the same routes, building time‑lapse records that turn the deep from a static postcard into a living, evolving archive.
Far below shipping lanes, three main characters now share the work: tethered vehicles steered from a ship, free‑roaming robots that follow prewritten scripts, and pressure‑resistant crewed craft for the rare times humans still go down in person. They’re coordinated like a layered medical team: first a wide “screening exam” to see the big picture, then targeted “scans” and finally surgical‑level precision when something important shows up.
Large survey vessels start by sweeping broad areas, covering thousands of square kilometers in a voyage. From those passes, scientists flag steep slopes, suspicious mounds, or unusual plumes as “targets.” Next, smaller vehicles are sent back to those specific spots, hugging the bottom at just tens of meters above the sediment. Flying that low lets their cameras and focused sounders pick out details you’d miss from higher up—boulder fields, fresh cracks, delicate coral gardens clinging to rock.
The prize is not just pretty terrain models; it’s hard numbers. Engineers tune instruments so each returning ping and pixel can be tied to exact coordinates, depth, and time. That precision matters when you’re deciding where to place a tsunami sensor, how close a cable can run to a landslide‑prone slope, or whether a gas seep sits inside a marine protected area. When a volcano off Tonga or an earthquake near Japan reshapes the bottom overnight, revisiting the same “before and after” tracks reveals which slopes failed, where new vents opened, and how those changes might steer future waves.
Growing battery capacity and miserly power electronics stretch how long these robots can stay out—dozens of hours at a time, soon to be weeks—while acoustically linked relay buoys drip data back to shore long before the vehicle is recovered. That near‑real‑time link lets teams replan on the fly: if a vehicle spots an unexpected cliff or a methane plume, the next dive can be redirected to slice right through it instead of waiting for the next expedition season.
These systems are also increasingly shared. Shipping companies, climate scientists, fisheries managers, and even telecom firms are learning to pool surveys so each crossing of the ocean adds another layer to a common seafloor “living map,” rather than vanishing into private archives.
One survey might trace a buried river channel snaking under the seabed—prime guidance for where storm-driven sediment will flow and where a future offshore wind farm’s cables might be safest. Another cruise focuses on fault lines, laying out dense grids of measurements so geophysicists can watch strain accumulate between quakes instead of guessing from sparse land stations. Fisheries teams piggyback on the same routes, adding acoustic profiles that reveal where swarms of krill or schools of tuna consistently gather around seamounts and shelf breaks, informing catch limits and seasonal closures.
Elsewhere, engineers fly repeated paths over aging pipelines, comparing centimeter-scale images from different years like radiologists lining up scans, searching for tiny shifts or new scars that could become leaks. In polar seas, under-ice missions chart ridges and keels carved into the underside of the ice sheet, data that plug straight into climate models trying to predict how fast that ice will melt and where cold, dense water will sink to drive global currents.
Within a decade, fleets of quiet machines may crisscross entire coastlines, stitching together “ocean diaries” that log every landslide, bloom, and leak. Ports could consult these records like doctors checking a patient’s chart before approving new shipping lanes. Insurance models, fisheries rules, even storm evacuation plans might update as fast as weather forecasts. But richer knowledge cuts both ways: it can guide protection—or be used to chase minerals and profits deeper into the dark.
Your challenge this week: any time you see a weather forecast, news about a storm, or discussion of sea‑level rise, pause and picture the hidden terrain beneath that patch of ocean. Ask: what decisions—like placing cables, warning coastal towns, or protecting reefs—might depend on someone having mapped that seafloor in detail?
Soon, the “blue” on maps may be as densely annotated as city streets. The more we learn, the more questions appear: which canyons funnel pollutants, which plateaus shelter larvae, which scars warn of past collapses? Multibeam passes and robotic dives are still just first drafts. As sensors shrink and fleets grow, we’ll move from static atlases to living, revisable stories of the deep—like shifting cloud maps that hint at coming weather we’re only beginning to read.