About half of people who buy health trackers stop using them within months. You wake up, glance at your sleep score, shrug, and move on. In this episode, we’ll flip that script and turn those random numbers into a simple, weekly check‑in that actually changes your habits.
Most people collect far more data than they can ever use. The result: graphs, charts, and trends that look impressive, but don’t change how you eat, move, or sleep. To make progress, you don’t need *more* data—you need *better questions* and a small set of metrics that directly connect to the goals you care about.
Think of this episode as moving from “tracking everything” to running a personal experiment. Instead of scrolling through 20 metrics, you’ll learn how to choose 3–5 that actually drive decisions—like resting heart rate, step count, protein grams, or bedtime consistency. We’ll connect these numbers to specific aging goals: preserving muscle, protecting your heart, and keeping your brain sharp into your 70s and 80s. By the end, you’ll know exactly what to track, how often, and how to review it so that every week, your data quietly nudges you toward a longer healthspan.
Here’s the missing piece: structure. Biohackers who age well don’t chase every new gadget; they run simple systems. They combine one wearable, a few lab tests, and a lightweight log to spot trends over months—not days. For example, a smartwatch plus quarterly bloodwork and a 2‑minute daily note can reveal that on weeks you average 6,000 steps, your RHR is 4 bpm higher and your mood scores drop 20%. In this episode, we’ll map out that kind of “tracking stack,” show you how to set a clean baseline over 14 days, and decide which numbers deserve daily, weekly, or quarterly attention.
Think of your tracking system in three layers: daily signals, weekly patterns, and periodic “deep dives.” Each layer answers a different question and prevents you from obsessing over any single number.
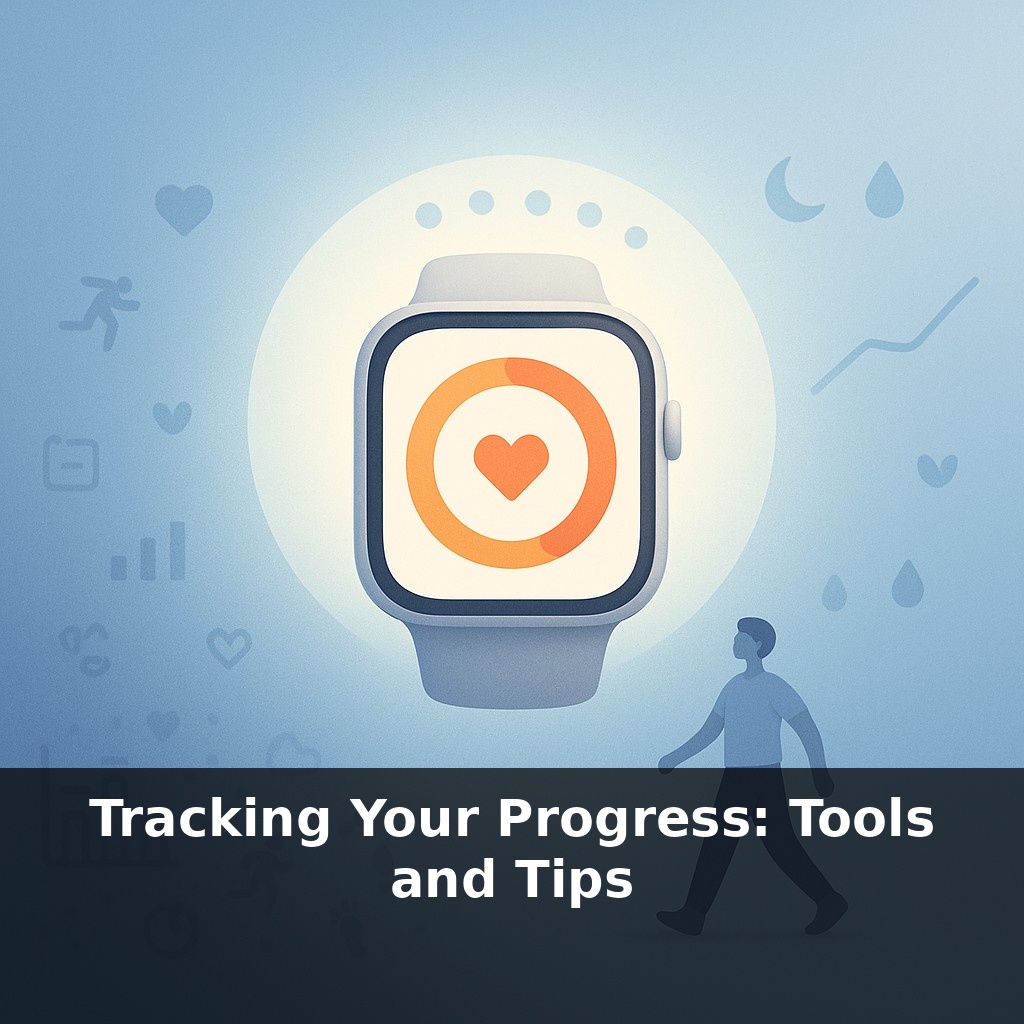
Start with daily signals. These are low‑friction metrics your wearable or app can capture automatically, plus one or two you log manually in under 60 seconds. For most people, 3–5 daily signals is plenty. For example: - Device‑captured: waking heart rate, total sleep duration, step count, and time in “vigorous” activity (e.g., ≥10 minutes with heart rate above 70% of estimated max). - Manual: a 1–5 energy score on waking, and a quick “how hard was today’s training?” using a 1–10 RPE (rate of perceived exertion) scale.
The daily rule: no decisions from a single bad (or great) number. Instead, watch for changes that persist at least 3 days in a row. An average 5+ bpm jump in waking heart rate over a week, or a run of three RPE‑9 workouts, is a useful flag; one rough night is not.
Next, build weekly patterns. Once per week, spend 10 minutes reviewing trends, not individual dots. Look for simple if‑then relationships: - “On weeks I average ≥7,500 steps, my waking heart rate runs ~3 bpm lower.” - “When my training RPE averages ≤6, I naturally walk ~2,000 steps more per day.” Even crude cutoffs (like 7,000 vs 10,000 steps, or RPE 6 vs 8) can reveal leverage points for energy, mood, and recovery.
Finally, schedule periodic deep dives. These are your lab tests and more detailed checks—done every 3–12 months—to make sure what “works” short‑term is also healthy long‑term. For example: - Twice per year: a basic blood panel (lipids, fasting glucose, A1c, kidney and liver markers) plus weight and waist circumference. - Once per year: a more comprehensive check—high‑sensitivity CRP, fasting insulin, and a body composition scan if available.
Consumer wearables and nutrition apps are imperfect, but when you anchor them to these slower‑moving markers, you can tell whether your daily tweaks are actually improving cardiovascular risk, metabolic health, and muscle preservation, or just nudging scores on your wrist.
Think of this like planning a hiking route instead of just wandering with a GPS. Take a 55‑year‑old who wants to preserve muscle and joint function. She tracks four daily signals: steps, vigorous‑minutes, a 1–5 morning energy score, and an RPE for her strength sessions. After 4 weeks, she notices that on weeks averaging 90–110 minutes of vigorous activity and RPE 6–7 strength work, her knees stay pain‑free and she climbs stairs without getting winded.
Another example: a 62‑year‑old man adds quarterly labs to his wearable data. His watch says he averages 8 hours in bed, but his hs‑CRP sits at 2.5 mg/L and fasting glucose around 102 mg/dL. He experiments with cutting late‑night snacks and adds a 15‑minute walk after dinner. By the next 3‑month check, hs‑CRP is down to 1.3 mg/L and fasting glucose to 93 mg/dL. Same “time in bed,” but different health trajectory—because he linked behaviors, daily signals, and deep‑dive markers into one coherent feedback loop instead of relying on surface‑level scores.
Smarter tracking today reshapes what’s possible in 5–10 years. As non‑invasive sensors spread, you may get continuous glucose, inflammation, or hormone trends passively, 24/7. That makes *how* you store and share data critical. Start organizing now: keep one master log of key numbers, dates, and major habit changes. Decide what you’d actually share with a clinician or coach. Treat privacy settings and data exports as seriously as your workouts—you’re curating your future health record.
Your challenge this week: build a “minimum viable dashboard.” Choose just 4 metrics—2 from your wearable, 1 from food, 1 from how you feel. For 7 days, log them in one place and add a 1‑sentence note (e.g., “late dinner, extra coffee”). Next week, adjust a single habit by 10–15% and watch how all four numbers respond.